US President with a Parliamentary System
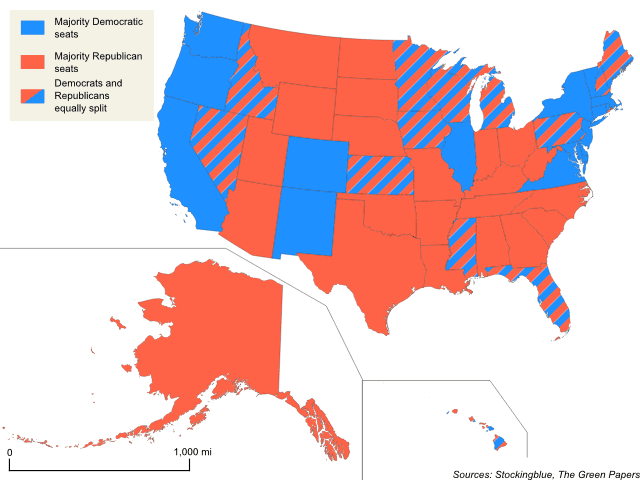
Yesterday's post looked into who would win the European Commission Presidency if the EU had an electoral college. Today's post flips the script and looks at who would be President, or rather, Prime Minister if the US had a parliamentary system. The map above shows which party would have the most seats in each state with a total of 435 seats and 218 needed to win. Since so many states came so close, they split the seats between Democrats and Republicans. In addition, three other parties make it into parliament, with the Libertarians, the Greens, and Utah's independent candidate Evan McMullin also gaining seats.
EU Commission President with an Electoral College System
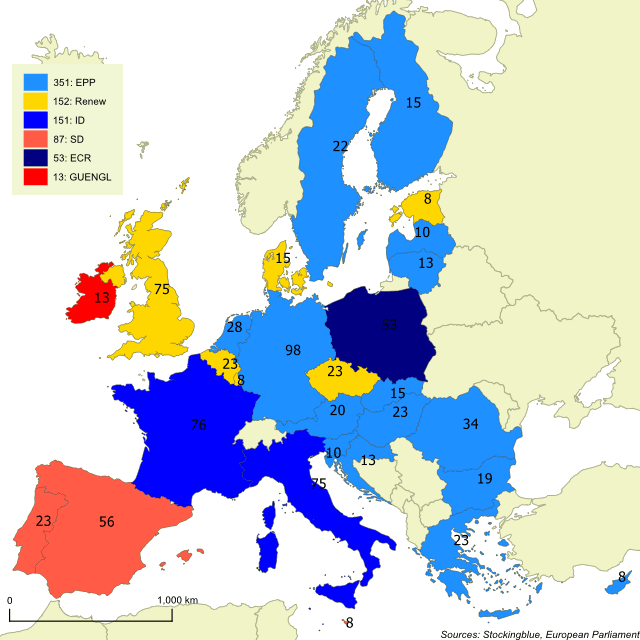
Recently, the European Union (EU) held an election to decide the representatives in the EU Parliament, the EU's equivalent to the House of Representatives in the US. After the election, a Commission President is selected based on the results and on input from another EU body (European Council) which consists of the heads of state of the 28 EU states. In this last election held on May 26, no party held a majority but the party with a plurality can attempt to form a coalition with other parties large enough to gain a majority. The results were so scattered however, that the three largest parties needed to form a coalition to gain a majority. Ultimately, they could not agree on a candidate to head the Commission and through backroom dealings, the European Council selected a candidate outside of the parties' leadership, and the Parliament voted her in this week. How would the election look if the EU had an electoral college? We take a look at the process below. The map above shows how many electors each party would get based on this election's results. Each state is given the number of representatives it has in the Parliament and one additional elector for each representative in the European Council and one for the Council of the European Union (so the number of parliamentarians plus two). These two bodies are not exact equivalents of our Senate, but in order to simplify the highly bureaucratic institutions of the EU, it will do for now. Another post looks at how the previous US presidential race would look with a parliamentary system.
The 2018 New York Gubernatorial Results Based on County Population
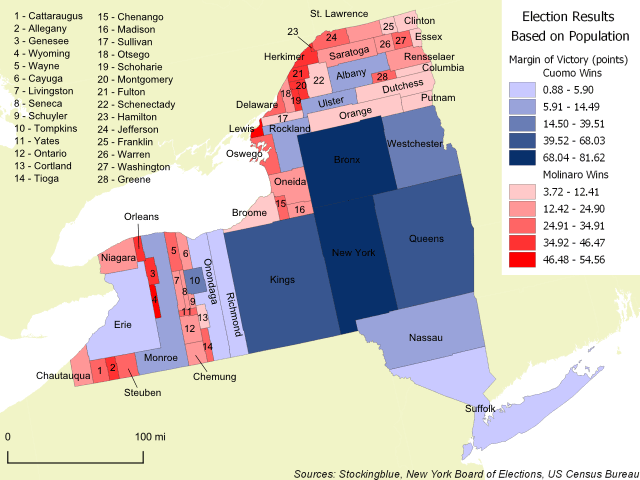
The geographically accurate cartogram above shows the 2018 gubernatorial results in New York based on county populations. The larger the county on this map, the larger its population. The map shows that even though Andrew Cuomo only won 15 of the 62 counties in the state, those 15 counties make up such a large chunk of the state's population that he could afford to lose 47 counties.
Voter Turnout by County in the 2018 Montana Senatorial Election
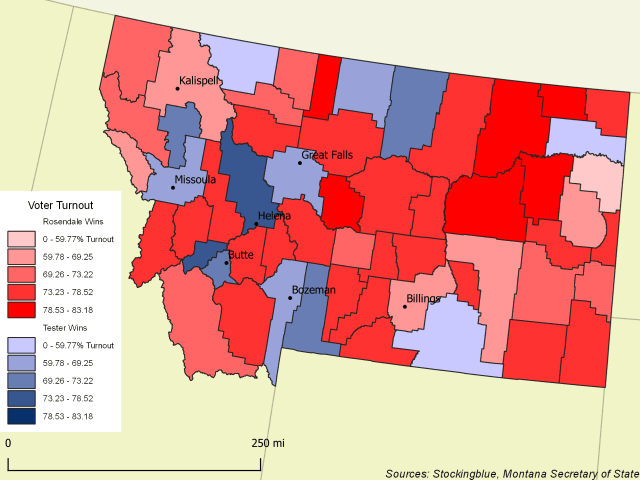
The map above shows the turnout and the candidate that won each county in the 2018 Senatorial election. Jon Tester did not win a single county where voter turnout was high, whereas Matt Rosendale won six counties where voters turned out in droves.
Voter Turnout and Results by County in the 2018 Montana Senatorial Election
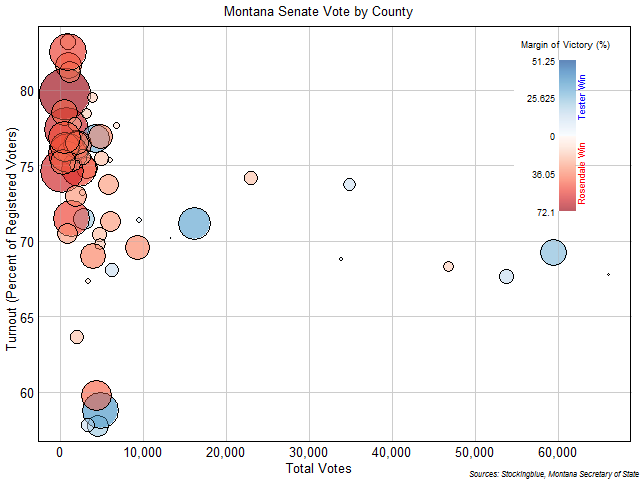
The chart above shows the total votes (x axis), the turnout (y axis), and the margin of victory (intensity of color and size of circle) for each county in the state of Montana. Jon Tester won two of the three largest counties as indicated by the blue circles to the right (just under the legend) with moderate margins. Matt Rosendale, on the other hand, won the majority of small counties (on the left of the chart) but with large margins. Rosendale also won the largest county, but with a very slim margin (small circle at the far right end). Rosendale also won counties with the largest voter turnout.
Voter Turnout by County in the 2018 Texas Senatorial Election
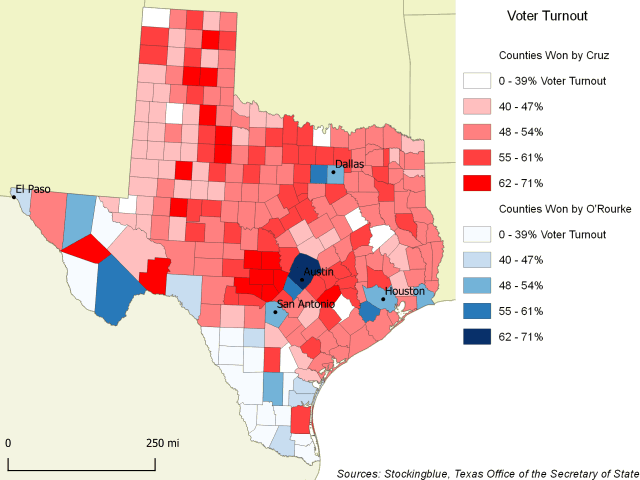
The map above shows the turnout and the candidate that won each county. The only place where Beto O'Rourke won and the turnout was high was in Austin and its northern suburbs. Every other county he won had either moderate or low turnout. Ted Cruz, on the other hand, had really high turnout in San Antonio's northern suburbs and various other counties throughout the state. He also won very few counties with low turnout.
Voter Turnout and Results by County in the 2018 Texas Senatorial Election
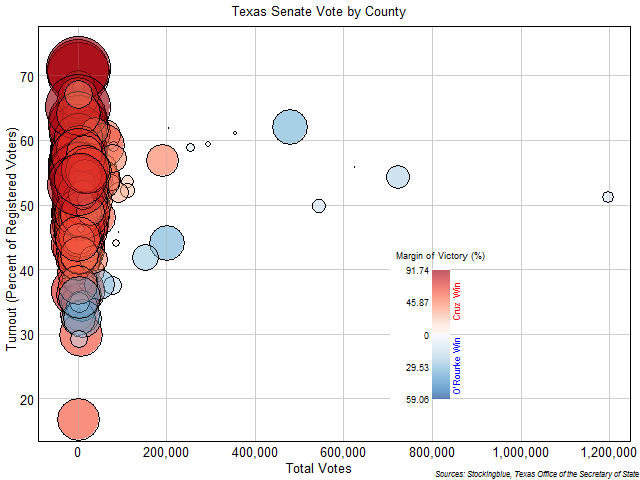
The chart above shows the total votes, the turnout, and the margin of victory for each county in the state of Texas. Beto O'Rourke won the five largest counties as indicated by the blue circles from the center to the right, but won them by such a small margin. Ted Cruz, on the other hand, won the majority of small counties but with really large margins. Ted Cruz won the counties with both the smallest and largest voter turnout.
Registered Voter Turnout in the 2017 Alabama Senatorial Election
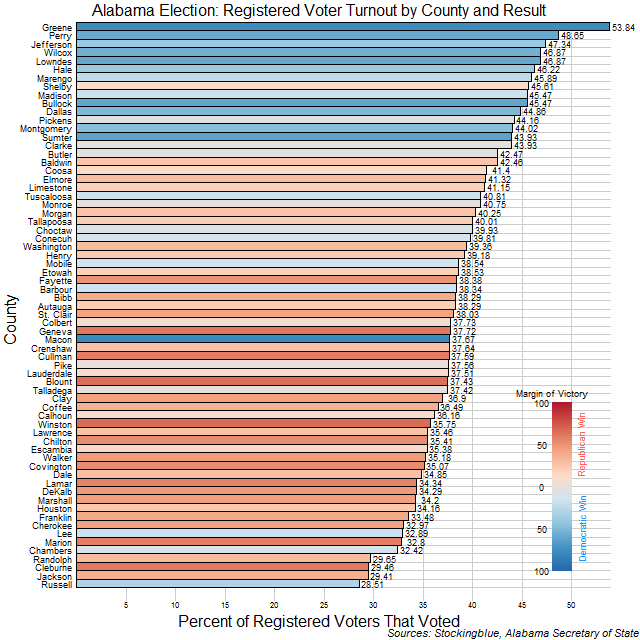
The chart above shows the percentage of registered voters that voted in each county and the party that won said county. The Democrats won the counties where a greater percentage of registered voters showed up to vote. The only decisive victory the Democrats had where registered voters did not really show up to the polls was in Macon County. The Republicans only won one county (Shelby) where registered voters actually showed up in great numbers.
Voter Registration in the 2017 Alabama Senatorial Election
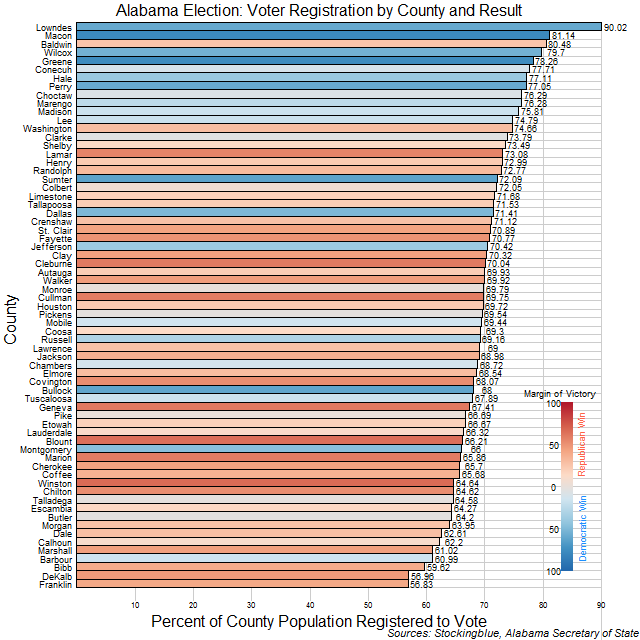
The chart above shows the percentage of people that are registered to vote in each county and the party that won each county. The Democrats won the counties where a greater percentage of the population is registered to vote. There are some anomalies in the data as Lowndes County has 90 percent of its population registered to vote but 30 percent of its population is under the age of 18 according to the US Census. Several other counties also had more registered voters than voters eligible to vote.
Voter Turnout in the 2017 Alabama Senatorial Election
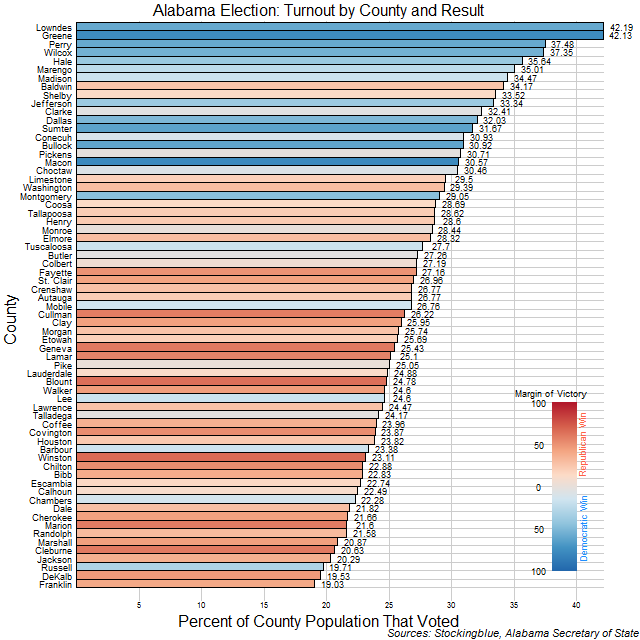
The chart above shows the percentage of people that voted in each county and the party that won each county. The Democrats won the counties where people went to the polls in droves while the Republicans won the counties where most people stayed home.
Older