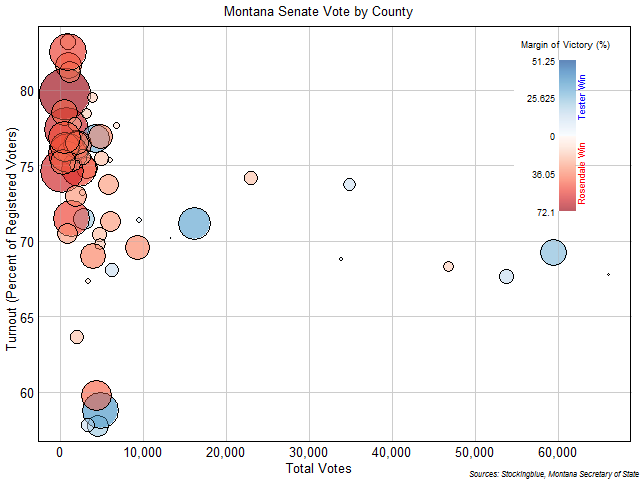
The chart above shows the total votes (x axis), the turnout (y axis), and the margin of victory (intensity of color and size of circle) for each county in the state of Montana. Jon Tester won two of the three largest counties as indicated by the blue circles to the right (just under the legend) with moderate margins. Matt Rosendale, on the other hand, won the majority of small counties (on the left of the chart) but with large margins. Rosendale also won the largest county, but with a very slim margin (small circle at the far right end). Rosendale also won counties with the largest voter turnout.
Findings
- Rosendale won 14 out of the 15 counties with the highest voter turnout.
- Conversely, Tester won 7 out of the 15 counties with the lowest voter turnout and the three counties with the lowest turnout.
- Out of the 56 counties in the state, all had a turnout of over 50 percent and 25 had a turnout of 75 percent or higher.
- Tester won only one of the 25 counties that had a turnout of over 75 percent.
- Only five counties (out of 56) had more than four-fifths of their registered population vote; Rosendale won all of these counties.
Caveats
- There may still be a few votes not counted.
Details
Although Rosendale won the counties with high turnout, Tester won the most populous counties with big enough margins, taking seven out of the top ten. However, Tester's largest margin of victory was 51.25 percentage points whereas Rosendale's was 72.10 percentage points. Rosendale won 6 counties with a higher margin of victory than O'Rourke's highest margin of victory.
Rosendale won 25 of the 25 least populous counties. Tester's least populous county was Blaine County, the state's 26th least populous one.
Data
| County | Rosendale (%) | Tester (%) | Margin of Victory |
|---|---|---|---|
| Beaverhead | 58.77 | 38.15 | 20.62 |
| Big Horn | 33.51 | 64.50 | -30.99 |
| Blaine | 33.36 | 64.11 | -30.75 |
| Broadwater | 63.90 | 32.89 | 31.01 |
| Carbon | 52.82 | 44.28 | 8.54 |
| Carter | 80.03 | 17.04 | 62.99 |
| Cascade | 45.75 | 51.30 | -5.55 |
| Chouteau | 49.32 | 48.03 | 1.29 |
| Custer | 56.54 | 39.78 | 16.76 |
| Daniels | 67.02 | 29.89 | 37.13 |
| Dawson | 66.37 | 30.17 | 36.20 |
| Deer Lodge | 28.37 | 68.46 | -40.09 |
| Fallon | 73.78 | 21.80 | 51.98 |
| Fergus | 62.85 | 33.87 | 28.98 |
| Flathead | 56.06 | 41.12 | 14.94 |
| Gallatin | 38.18 | 59.29 | -21.11 |
| Garfield | 83.85 | 11.75 | 72.10 |
| Glacier | 23.47 | 74.72 | -51.25 |
| Golden Valley | 66.74 | 28.60 | 38.14 |
| Granite | 58.41 | 38.68 | 19.73 |
| Hill | 38.44 | 58.05 | -19.61 |
| Jefferson | 53.44 | 43.23 | 10.21 |
| Judith Basin | 63.27 | 32.43 | 30.84 |
| Lake | 47.60 | 49.78 | -2.18 |
| Lewis and Clark | 39.61 | 57.81 | -18.20 |
| Liberty | 59.71 | 37.22 | 22.49 |
| Lincoln | 65.74 | 31.07 | 34.67 |
| Madison | 58.41 | 38.15 | 20.26 |
| McCone | 75.12 | 22.06 | 53.06 |
| Meagher | 64.37 | 32.75 | 31.62 |
| Mineral | 57.38 | 38.19 | 19.19 |
| Missoula | 30.45 | 67.42 | -36.97 |
| Musselshell | 75.27 | 24.73 | 50.54 |
| Park | 44.84 | 52.59 | -7.75 |
| Petroleum | 79.49 | 18.59 | 60.90 |
| Phillips | 68.58 | 27.62 | 40.96 |
| Pondera | 52.99 | 43.54 | 9.45 |
| Powder River | 76.85 | 20.88 | 55.97 |
| Powell | 59.42 | 37.21 | 22.21 |
| Prairie | 68.91 | 27.11 | 41.80 |
| Ravalli | 58.29 | 39.05 | 19.24 |
| Richland | 69.64 | 26.20 | 43.44 |
| Roosevelt | 39.17 | 58.27 | -19.10 |
| Rosebud | 52.51 | 44.77 | 7.74 |
| Sanders | 62.76 | 33.55 | 29.21 |
| Sheridan | 56.11 | 39.30 | 16.81 |
| Silver Bow | 25.93 | 71.64 | -45.71 |
| Stillwater | 65.81 | 30.94 | 34.87 |
| Sweet Grass | 65.13 | 31.31 | 33.82 |
| Teton | 56.44 | 40.95 | 15.49 |
| Toole | 63.37 | 32.98 | 30.39 |
| Treasure | 67.39 | 31.16 | 36.23 |
| Valley | 55.08 | 39.77 | 15.31 |
| Wheatland | 62.64 | 33.88 | 28.76 |
| Wibaux | 71.96 | 25.83 | 46.13 |
| Yellowstone | 50.23 | 46.42 | 3.81 |
Sources
Montana Secretary of State. "2018 General Election - November 6, 2018." Accessed November 9, 2018. http://mtelectionresults.gov/resultsSW.aspx?type=FED&map=CTY.