EU and US Regions by Gross Domestic Product per Area
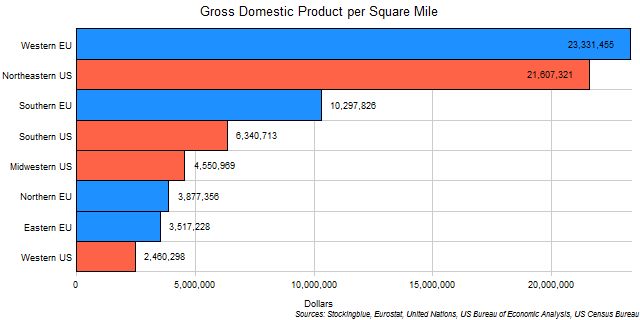
The chart above shows the Purchasing Power Parity Gross Domestic Product (GDP PPP) of EU and US regions per square mile of territory in US dollars. Only three regions produce over $10 million per square mile of territory: the Western EU, the Northeastern US, and the Southern EU; while only the Western EU and the Northeastern US make over $20 million.
EU Regions by Gross Domestic Product per Area

The chart above shows the Purchasing Power Parity Gross Domestic Product (GDP PPP) of EU regions per square kilometer of territory in euros. The Western EU has such a high GDP per area that it is more than double the remaining regions' combined GDP per area.
US Regions by Gross Domestic Product per Area

The chart above shows the Purchasing Power Parity Gross Domestic Product (GDP PPP) of US regions per square mile of territory in US dollars. The Northeast has such a high GDP per area that it would be nearly twice as much as the three other regions combined.
EU and US States Ranked by Gross Domestic Product per Area
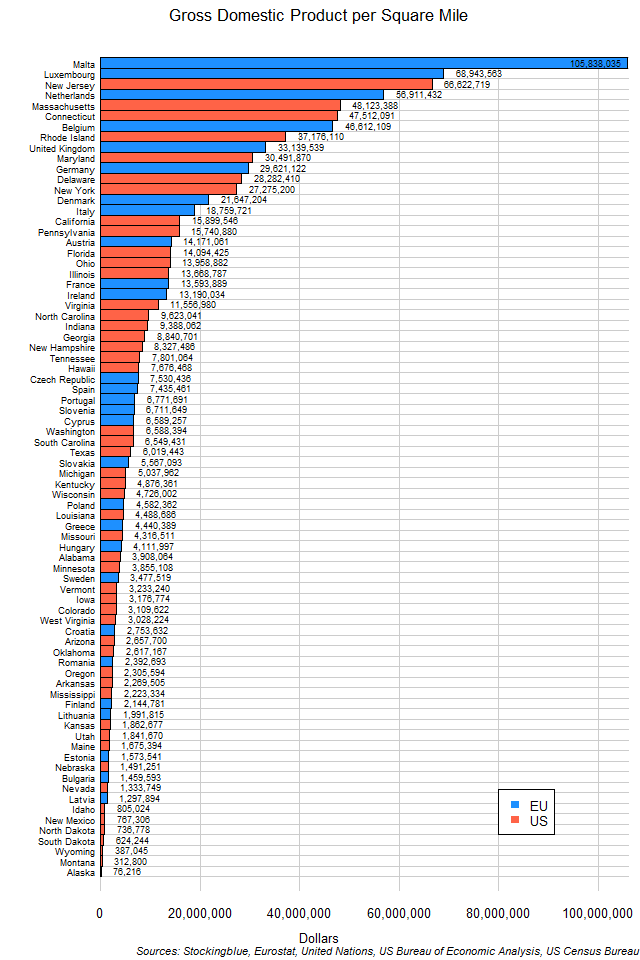
The chart above shows the Purchasing Power Parity Gross Domestic Product (GDP PPP) of EU and US states per square mile of territory in US dollars. EU and US states are distributed pretty much equally in this metric.
US States Ranked by Gross Domestic Product per Area
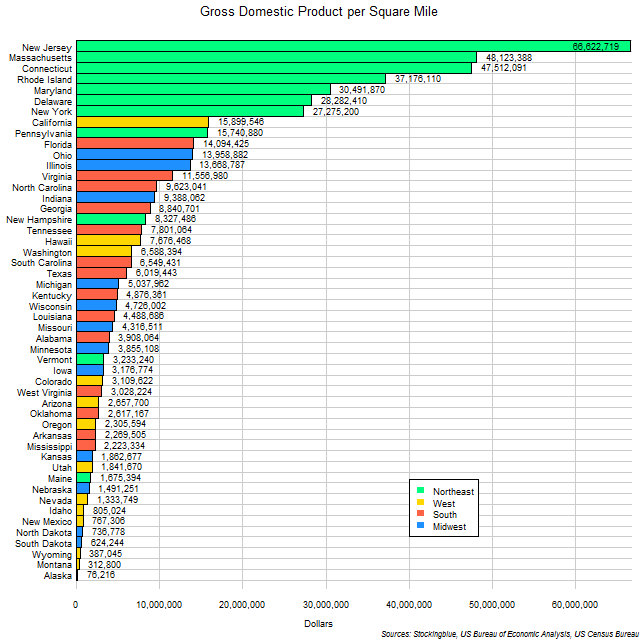
The chart above shows the Purchasing Power Parity Gross Domestic Product (GDP PPP) of US states per square mile of territory. The Northeast does really well in this metric.
EU States Ranked by Gross Domestic Product per Area
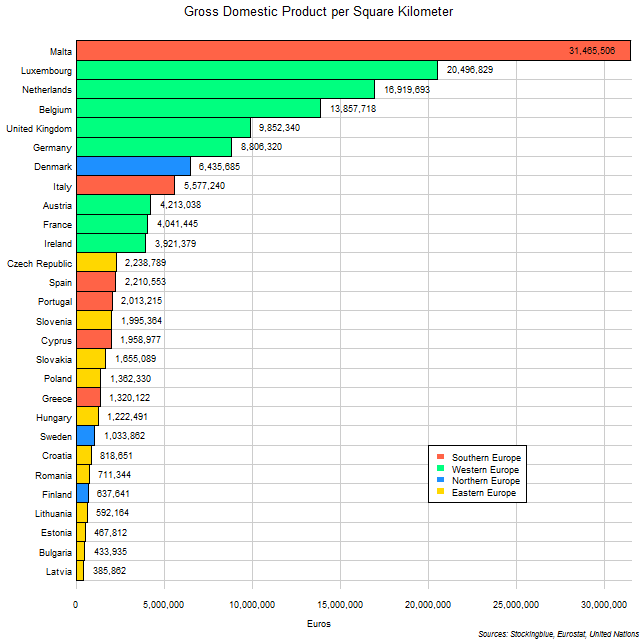
The chart above shows the Purchasing Power Parity Gross Domestic Product (GDP PPP) of EU states per square kilometer of territory. Even though Western EU states have relatively large states, they still manage an impressive showing.
Per Capita Gross Domestic Product in EU and US States
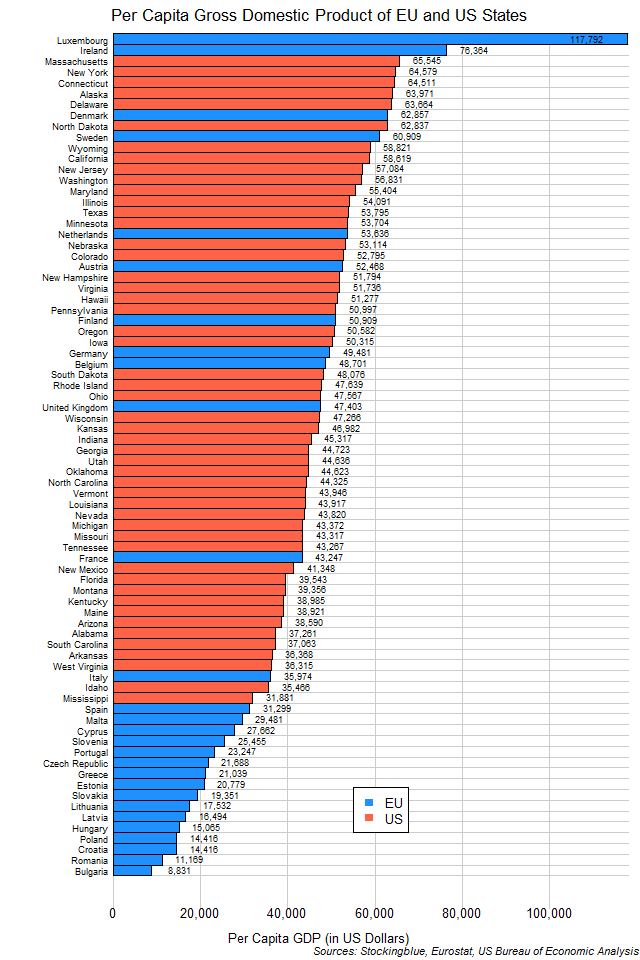
The chart above shows the per capita GDP of EU and US states. Although the EU has the two states with the highest per capita GDP, it also has the 16 states with the lowest per capita GDP.
US States by Per Capita Gross Domestic Product
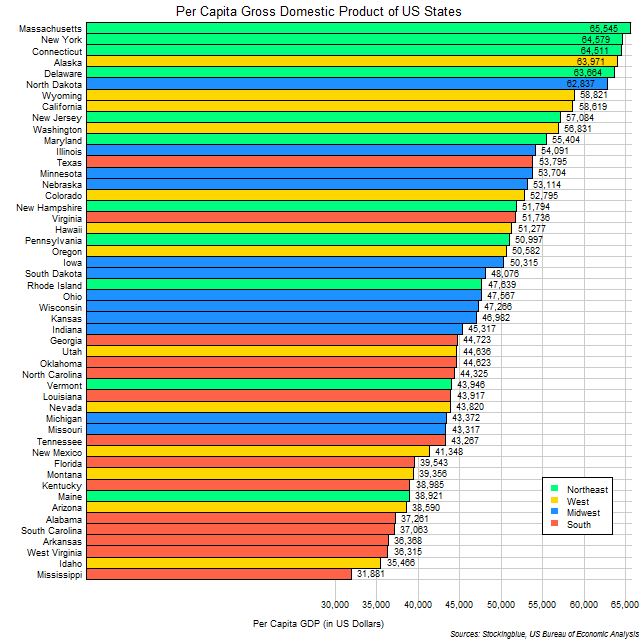
The chart above shows the per capita GDP of US states. Every single state in the US has a per capita GDP of over $30,000 whereas in the EU over half do not as is shown in the previous report.
EU States by Per Capita Gross Domestic Product
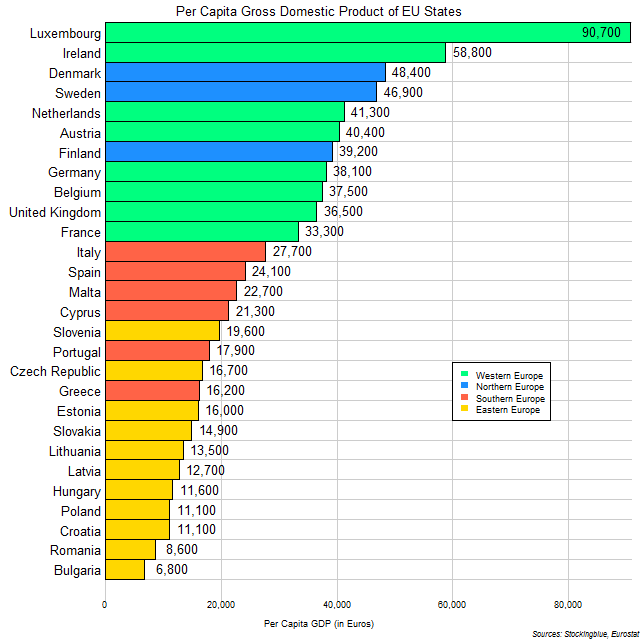
The chart above shows the per capita GDP of EU states. Northern and Western European states all have a per capita GDP of over €30,000 while all Southern and Eastern European states fall below that threshold.
EU and US Regions by Gross Domestic Product
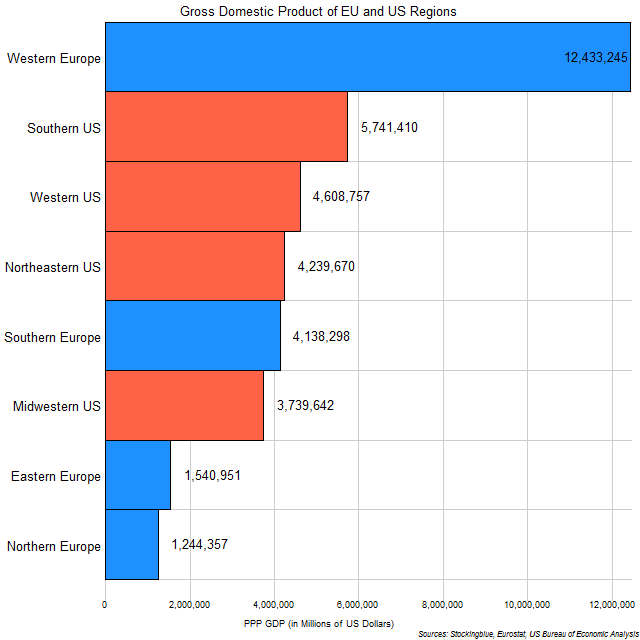
The chart above shows the regional economies of the European Union and the United States. Clearly wealth is distributed far more equally between regions in the US than it is in the EU.
Older