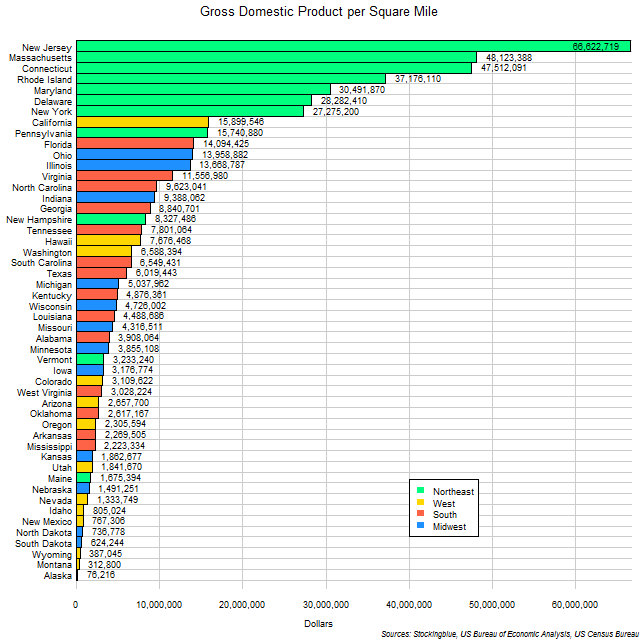
The chart above shows the Purchasing Power Parity Gross Domestic Product (GDP PPP) of US states per square mile of territory. The Northeast does really well in this metric.
Findings
- The difference between the largest GDP PPP per area state, New Jersey, and the smallest, Alaska, is $66,546,503.
- New Jersey's GDP PPP per area, is 874.13 times larger than Alaska's.
- Every single state outside of the Northeast has a GDP PPP under $20,000,000 per square mile of territory.
- Only California and Florida break the top ten outside of the Northeast. The Midwest's best showing, Ohio, comes in eleventh.
Caveats
- Area data is from 2010.
- GDP data is from 2016.
- The area includes both land and water area.
- GDP and area data are from two different sources.
Details
Moderate sized states that are part of a region where many people live tend to have high per area GDPs. Really large states with very few people, Alaska, do not.
At first glance this seems to correlate well with population density and that would make sense as the more people there are at any given place, the more wealth they are likely to create in that given place.
Sources
US Bureau of Economic Analysis. 2017. "Regional Data." Accessed October 26, 2017. https://bea.gov/itable/iTable.cfm?ReqID=70&step=1#reqid=70&step=1&isuri=1.
United States Census Bureau. "Annual Estimates of the Resident Population: April 1, 2010 to July 1, 2016." Accessed December 12, 2017. http://factfinder2.census.gov.