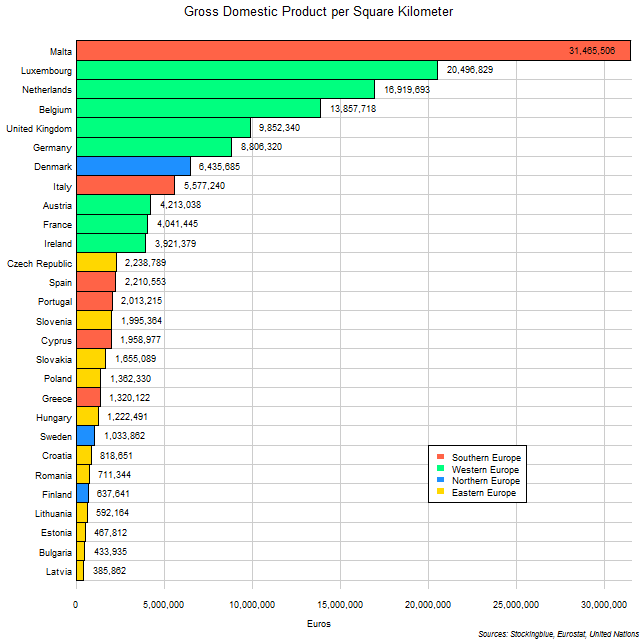
The chart above shows the Purchasing Power Parity Gross Domestic Product (GDP PPP) of EU states per square kilometer of territory. Even though Western EU states have relatively large states, they still manage an impressive showing.
Findings
- The difference between the largest GDP PPP per area state, Malta, and the smallest, Latvia, is 31,079,644 euros.
- Malta's GDP PPP per area, is 81.55 times larger than Latvia's.
- Every single Eastern EU state has a GDP PPP of less than €2.5 million per square kilometer of territory.
- Every single Western EU state has a GDP PPP of at least €3.5 million per square kilometer of territory.
Caveats
- Area data is from 2007.
- GDP data is from 2016.
- GDP and area data are from two different sources.
- Area and GDP data for France only includes metropolitan France. Apparently, France sometimes includes overseas territories in these figures, not here.
Details
It is pretty impressive that geographically large states like Germany and the United Kingdom can rank so high in this metric. Unfortunately, this metric falls short because states like Finland and Sweden have so much territory that is sparsely populated and is unlikely to be economically exploited. Perhaps having arable land as the denominator would be a better metric.
Although most wealth is produced in certain parts of the country and land values tend to vary wildly within each country, it would be interesting to see how this metric correlates with land values in each country. Perhaps mean or median land values can be looked at to see if land is valued considerably higher than the amount of wealth generated by each state relative to the amount of territory within it.
Sources
Eurostat. 2017. "Gross Domestic Product at Market Prices. Accessed October 26, 2017. http://ec.europa.eu/eurostat/tgm/refreshTableAction.do?tab=table&plugin=1&pcode=tec00001&language=en.
United Nations. 2007. "United Nations Statistics Division - Environment Statistics." Accessed January 23, 2018. https://unstats.un.org/unsd/environment/totalarea.htm.