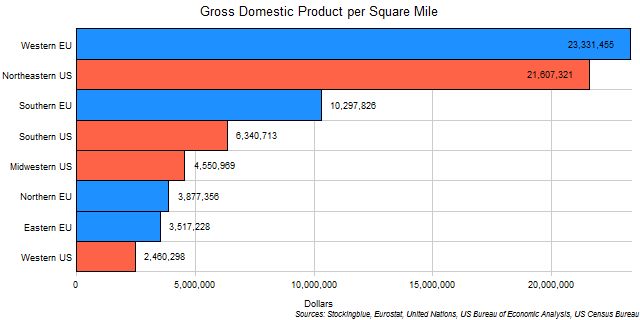
The chart above shows the Purchasing Power Parity Gross Domestic Product (GDP PPP) of EU and US regions per square mile of territory in US dollars. Only three regions produce over $10 million per square mile of territory: the Western EU, the Northeastern US, and the Southern EU; while only the Western EU and the Northeastern US make over $20 million.
Findings
- The difference between the largest GDP PPP per area region, the Western EU, and the smallest, the Western US, is $20,871,157.
- The Western EU's GDP PPP per area, is 9.48 times larger than the Western US's.
- Th Northeastern US has a GDP per area that is 92% that of the Western EU's. It is followed by the Southern EU which has a GDP per area that is merely 48% of the Northeastern US while the Southern US has a GDP per area that is 62% that of the Southern EU.
- At the bottom, the Midwestern US has a GDP per area that is 72% of the Southern US, while the Northern EU has a GDP per area that is 85% that of the Midwestern US. The Eastern EU has a GDP per area that is 91% that of the Northern EU, and finally the Western US has a GDP per area that is 70% that of the Eastern EU's.
Caveats
- Area data for the EU is from 2007 and for the US if from 2010.
- GDP data is from 2016 for both the EU and the US.
- The area includes both land and water area.
- GDP and area data are from different sources.
- EU and US data are from different sources.
- EU data was converted from euros to dollars at the average 2016 0.77 euros to dollars rate.
- The Western EU consists of Germany, United Kingdom, France, Netherlands, Belgium, Austria, Ireland, and Luxembourg.
- The Northeastern US consists of New York, Pennsylvania, New Jersey, Massachusetts, Maryland, Connecticut, New Hampshire, Delaware, Maine, Rhode Island, and Vermont.
- The Southern EU consists of Italy, Spain, Portugal, Greece, Cyprus, and Malta.
- The Southern US consists of Texas, Florida, Georgia, North Carolina, Virginia, Tennessee, Louisiana, South Carolina, Alabama, Kentucky, Oklahoma, Arkansas, Mississippi, and West Virginia.
- The Midwestern US consists of Illinois, Ohio, Michigan, Indiana, Minnesota, Wisconsin, Missouri, Iowa, Kansas, Nebraska, North Dakota, and South Dakota.
- The Northern EU consists of Sweden, Denmark, and Finland.
- The Eastern EU consists of Poland, Czech Republic, Romania, Hungary, Slovakia, Bulgaria, Croatia, Slovenia, Lithuania, Latvia, and Estonia.
- The Western US consists of California, Washington, Colorado, Arizona, Oregon, Utah, Nevada, New Mexico, Hawaii, Idaho, Alaska, Montana, and Wyoming.
Details
In both the European Union and the United States, it is one region that dominates over the others in this metric. These two dominant regions, the Western EU and the Northeastern US, have a greater GDP per area than all of the other regions combined.
The reasons for this disparity are diverse. The Western US, for instance is a vast expanse that is not as heavily populated while a region like the Eastern EU just does not have the economic activity that the Western EU does.
Sources
Eurostat. 2017. "Gross Domestic Product at Market Prices. Accessed October 26, 2017. http://ec.europa.eu/eurostat/tgm/refreshTableAction.do?tab=table&plugin=1&pcode=tec00001&language=en.
United Nations. 2007. "United Nations Statistics Division - Environment Statistics." Accessed January 23, 2018. https://unstats.un.org/unsd/environment/totalarea.htm.
US Bureau of Economic Analysis. 2017. "Regional Data." Accessed October 26, 2017. https://bea.gov/itable/iTable.cfm?ReqID=70&step=1#reqid=70&step=1&isuri=1.
United States Census Bureau. "Annual Estimates of the Resident Population: April 1, 2010 to July 1, 2016." Accessed December 12, 2017. http://factfinder2.census.gov.