The Correlation between GDP PPP Per Capita and GDP PPP Per Area Worldwide
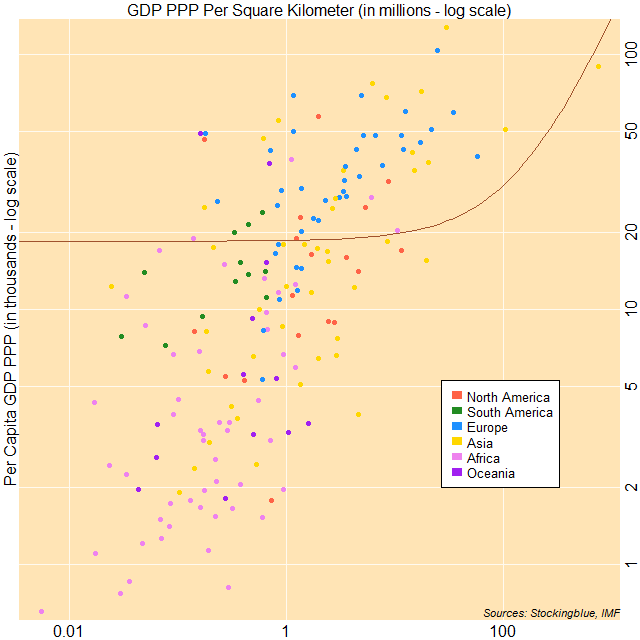
The correlation between per capita gross domestic product based on purchasing power parity (GDP PPP) and GDP PPP per area worldwide is moderately weak. The three largest economies on a per capita basis have a high per area GDP relative to other countries.
Gross Domestic Product by Arable Land Worldwide
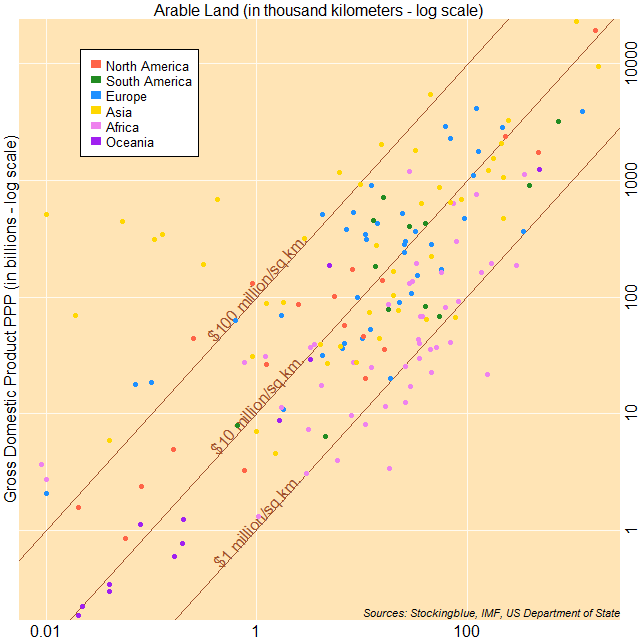
The chart above shows economic output as it relates to arable land. The countries to the top left have a larger ratio of gross domestic product (GDP) to arable land, while countries to the bottom right have a smaller ratio of GDP to arable land. Asia has the countries that have the largest ratio of GDP to area whereas Africa has the countries that have the smallest ratio of GDP to area.
Gross Domestic Product by Land Area Worldwide
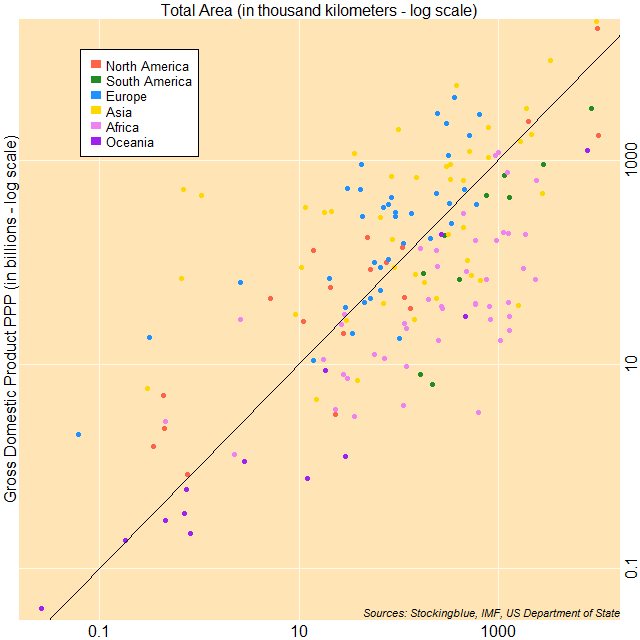
The chart above shows economic output as it relates to land area. The countries to the top left of the diagonal line have a gross domestic product (GDP) of over one million international dollars per square kilometer, while countries to the bottom right have a GDP that is less than one million dollars per square kilometer. Asia has the countries with the largest ratios of GDP to area whereas the Africa has the countries with the smallest ratios of GDP to area.
The Correlation between Minimum Wage and Shadow Economies Worldwide
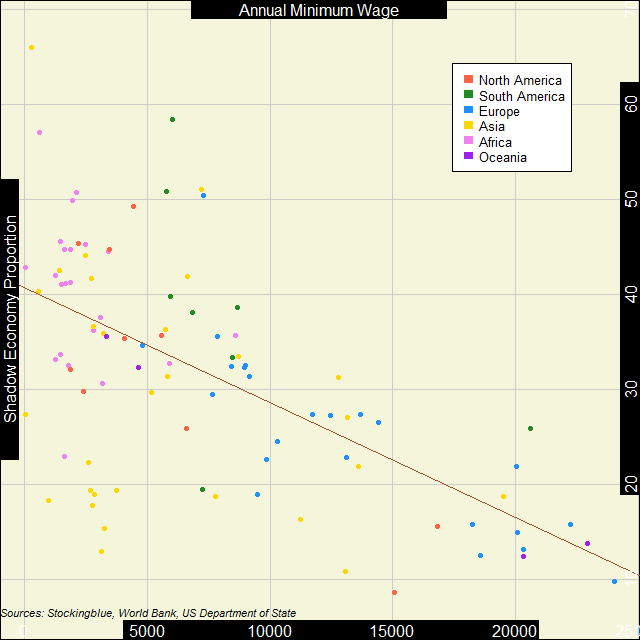
Worldwide, the inverse correlation between the strength of the shadow economy and the minimum wage is pretty strong. As the proportion of the shadow economy decreases, the minimum wage tends to go up.
The Correlation between Minimum Wage and Economic Strength Worldwide
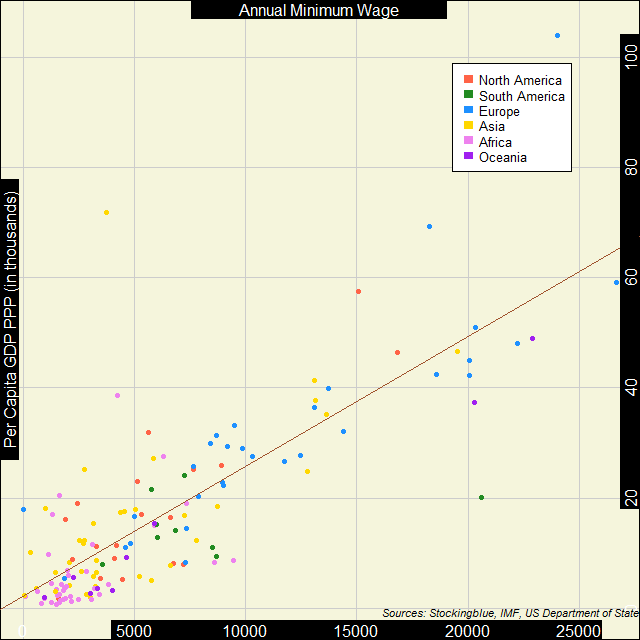
Worldwide, the correlation between economic strength and the minimum wage is pretty strong. Most countries have low minimum wages and a small per capita GDP PPP.
The Correlation between Shadow Economies and Economic Strength Worldwide
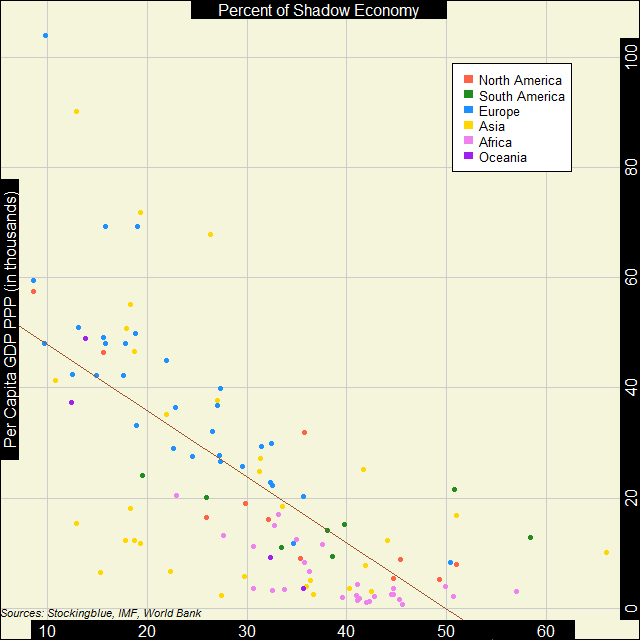
The correlation between economic strength and the strength of the shadow economy is moderate. Europe and Asia have the countries with the highest per capita GDP PPP while all continents except for Oceania have nations whose shadow economies make up more than half of their overall economies.