The European Union's Borders Based on Gross Domestic Product
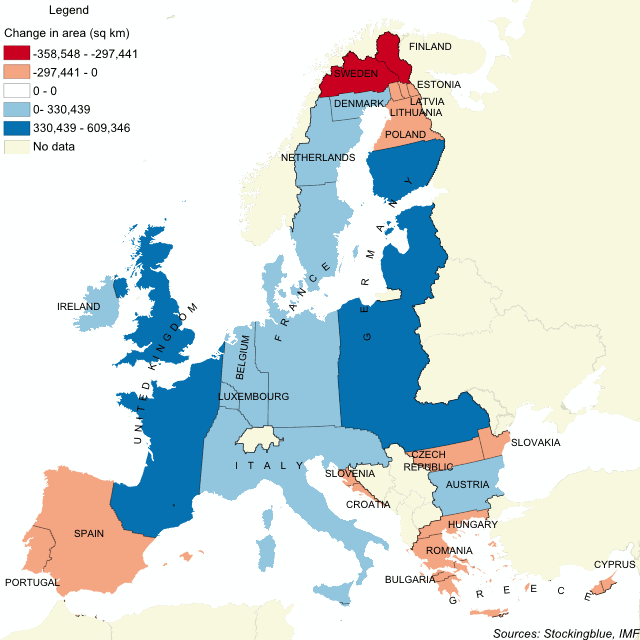
This geographically accurate cartogram represents how the EU's borders would have been had they been drawn up according to each country's GDP. The United Kingdom, France, Germany, and Italy take up large swaths of the Union leaving the remaining states crunched up against each other.
The European Union's Borders by Military Personnel
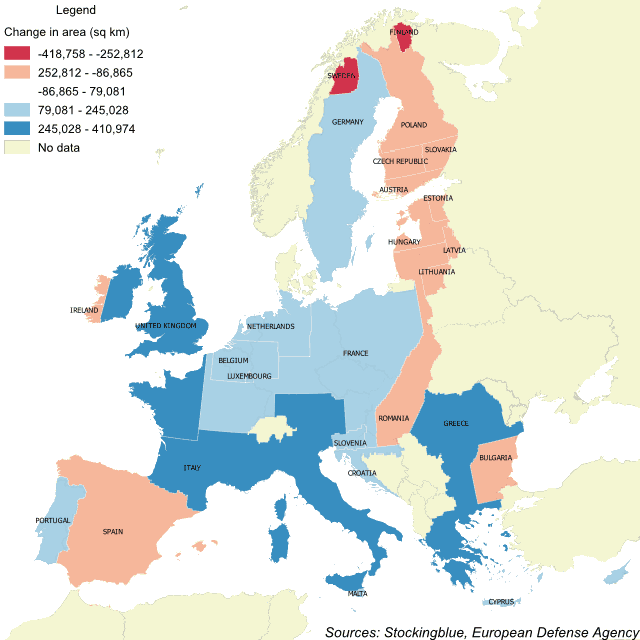
Altering the borders of the European Union based on the number of military personnel each state has creates an unrecognizable European Union. In this geographically accurate cartogram, the United Kingdom, Italy, and Greece expand their borders drastically while Sweden and Finland cede much of their territory.
The Geographic Distribution of Military Personnel in the European Union
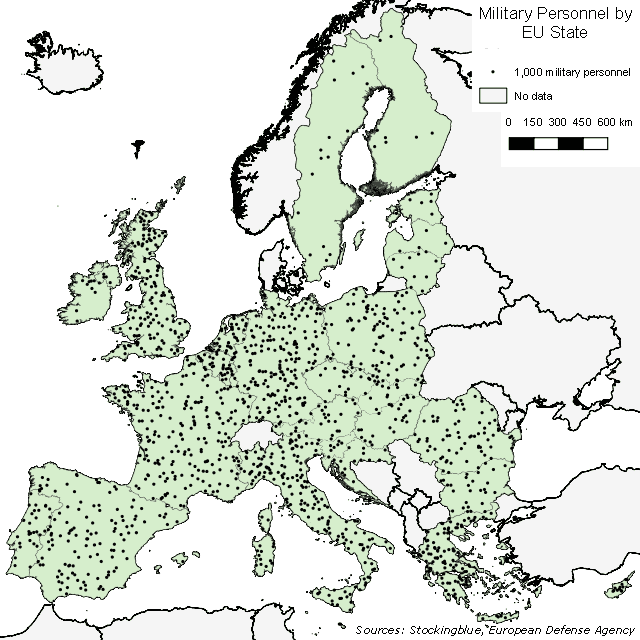
The EU, if it were to ever have a unified military force would see most of its personnel come from very few states. As can be seen in the map above, Nordic and Baltic countries have a limited number of military personnel.
The Correlation between GDP PPP Per Capita and GDP PPP Per Area in Europe
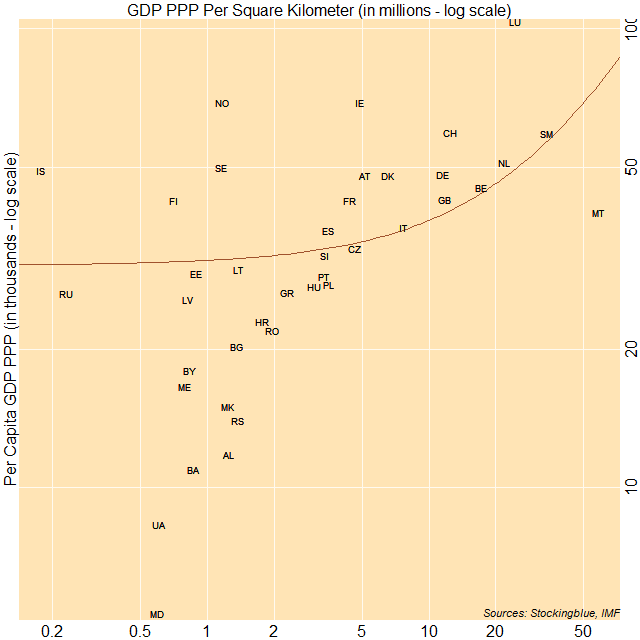
The correlation between per capita gross domestic product based on purchasing power parity (GDP PPP) and GDP PPP per area in Europe is moderate. The three largest economies on a per capita basis have either a low, moderate, or high per area GDP relative to other countries on the continent.
Gross Domestic Product by Arable Land in Europe
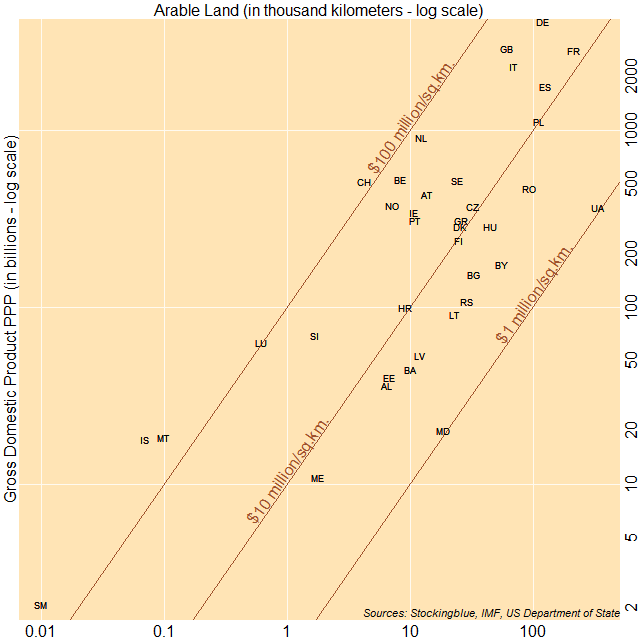
The chart above shows economic output as it relates to arable land. The countries to the top left have a larger ratio of gross domestic product (GDP) to arable land, while countries to the bottom right have a smaller ratio of GDP to arable land. Iceland, San Marino, and Malta have the largest ratio of GDP to area whereas Moldova, Ukraine, and Belarus have the smallest ratio of GDP to area.
Gross Domestic Product by Land Area in Europe
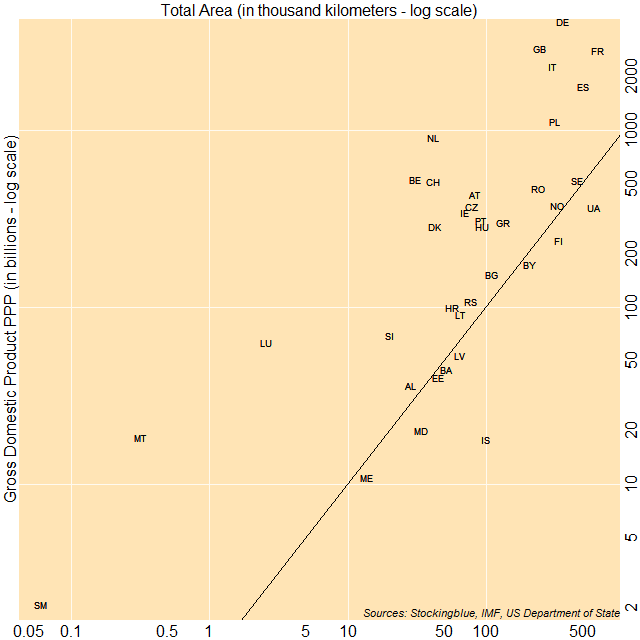
The chart above shows economic output as it relates to land area. The countries to the top left of the diagonal line have a gross domestic product (GDP) of over one million international dollars per square kilometer, while countries to the bottom right have a GDP that is less than one million dollars per square kilometer. Malta, San Marino, and Luxembourg have the largest ratio of GDP to area whereas Iceland, Moldova, and Ukraine have the smallest ratio of GDP to area.
The Correlation between Minimum Wage and Shadow Economies in Europe
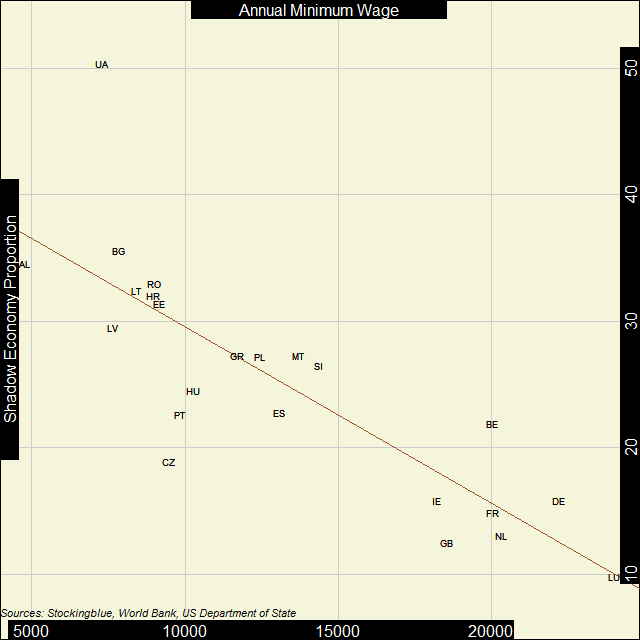
In Europe, the inverse correlation between the strength of the shadow economy and the minimum wage is very strong. As the shadow economy weakens, the minimum wage tends to be higher.
The Correlation between Minimum Wage and Economic Strength in Europe
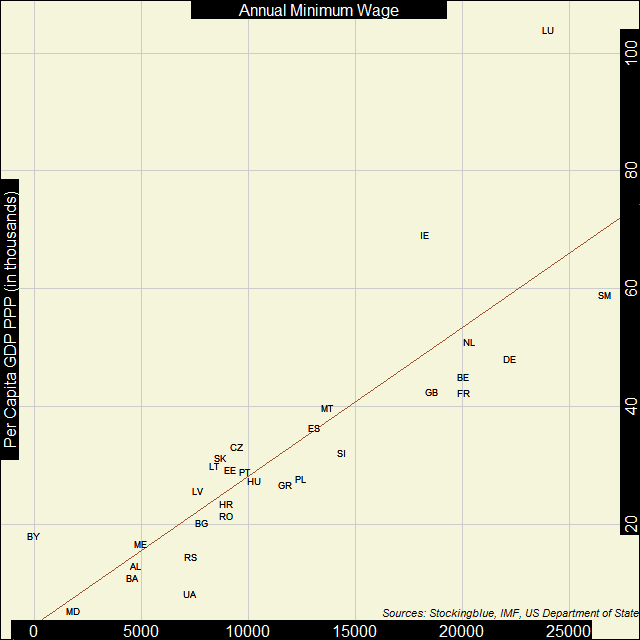
In Europe, the correlation between economic strength and the minimum wage is pretty strong. Just like with the shadow economy data, minimum wage tends to be similar to geographically proximate countries.
The Correlation between Shadow Economies and Economic Strength in Europe
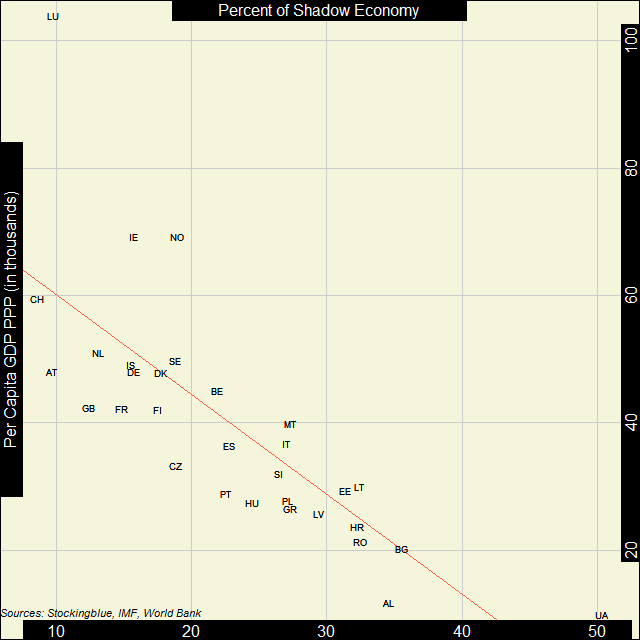
In Europe, the correlation between economic strength and the strength of the shadow economy is pretty strong. Every country studied on the continent - excluding Albania, Bulgaria, and Ukraine - has a shadow economy that takes up at most one-third of its overall economy.
Older