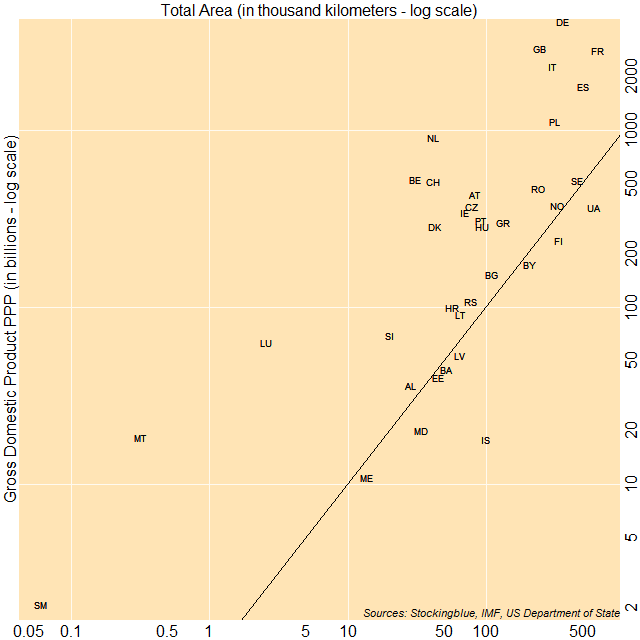
The chart above shows economic output as it relates to land area. The countries to the top left of the diagonal line have a gross domestic product (GDP) of over one million international dollars per square kilometer, while countries to the bottom right have a GDP that is less than one million dollars per square kilometer. Malta, San Marino, and Luxembourg have the largest ratio of GDP to area whereas Iceland, Moldova, and Ukraine have the smallest ratio of GDP to area.
Findings
- Europe has several countries that make over 10 million international dollars per square kilometer.
- Iceland has the smallest ratio of GDP to area with an economy of just over 178,000 times that of its area in square kilometers.
- Malta has the largest ratio of GDP to area with an economy of just over 58 million times that of its area in square kilometers.
- Only Iceland has a GDP that is less than 50,000 international dollars per square kilometer.
Caveats
- A country with a large landmass and a small population is likely to have a smaller ratio, whereas a small country with a large population density can have a larger ratio. Thus the data may not reflect how productive a country is.
- Andorra, Faroe Islands, Gibraltar, Guernsey, Vatican City, Isle of Man, Jersey, Liechtenstein, the Former Yugoslav Republic of Macedonia, Monaco, Russia, and Slovakia were missing data.
Details
The countries that produce less than one million international dollars per square kilometer are either Balkan states, former Soviet republics, or Iceland or Finland. The only former Soviet republic to make over one million international dollars per square kilometer is Lithuania.
Of the six economies that have a GDP of over one trillion international dollars (Germany, United Kingdom, France, Italy, Spain, and Poland), only the United Kingdom and Germany have a GDP per square kilometer of over 10 million international dollars.
Data
| Code | Country | Area (square km) | GDP (in millions) | GDP Per Square Kilometer |
|---|---|---|---|---|
| IS | Iceland | 100,250 | 17,846 | 178,015.0 |
| MD | Moldova | 33,851 | 20,207 | 596,939.5 |
| UA | Ukraine | 603,550 | 368,047 | 609,803.7 |
| FI | Finland | 338,145 | 239,662 | 708,755.1 |
| ME | Montenegro | 13,812 | 10,934 | 791,630.5 |
| LV | Latvia | 64,589 | 53,268 | 824,722.5 |
| BY | Belarus | 207,600 | 173,405 | 835,284.2 |
| BA | Bosnia and Herzegovina | 51,197 | 44,462 | 868,449.3 |
| EE | Estonia | 45,228 | 40,275 | 890,488.2 |
| SE | Sweden | 450,295 | 522,849 | 1,161,125.5 |
| NO | Norway | 323,802 | 377,100 | 1,164,600.6 |
| AL | Albania | 28,748 | 36,198 | 1,259,148.5 |
| BG | Bulgaria | 110,879 | 152,079 | 1,371,576.2 |
| RS | Serbia | 77,474 | 107,131 | 1,382,799.4 |
| LT | Lithuania | 65,300 | 90,387 | 1,384,180.7 |
| HR | Croatia | 56,594 | 100,006 | 1,767,077.8 |
| RO | Romania | 238,391 | 470,312 | 1,972,859.7 |
| GR | Greece | 131,957 | 302,150 | 2,289,761.1 |
| HU | Hungary | 93,028 | 284,266 | 3,055,703.7 |
| PT | Portugal | 92,090 | 310,651 | 3,373,341.3 |
| SI | Slovenia | 20,273 | 69,358 | 3,421,200.6 |
| ES | Spain | 505,370 | 1,768,816 | 3,500,041.5 |
| PL | Poland | 312,685 | 1,114,105 | 3,563,026.7 |
| FR | France | 643,801 | 2,833,064 | 4,400,527.5 |
| CZ | Czech Republic | 78,867 | 368,659 | 4,674,439.2 |
| IE | Ireland | 70,273 | 343,682 | 4,890,669.2 |
| AT | Austria | 83,871 | 432,424 | 5,155,822.6 |
| DK | Denmark | 43,094 | 284,040 | 6,591,172.8 |
| IT | Italy | 301,338 | 2,303,108 | 7,642,939.2 |
| DE | Germany | 357,022 | 4,134,668 | 11,580,989.4 |
| GB | United Kingdom | 243,610 | 2,905,392 | 11,926,407.0 |
| CH | Switzerland | 41,277 | 514,162 | 12,456,380.1 |
| BE | Belgium | 30,528 | 529,289 | 17,337,821.0 |
| NL | Netherlands | 41,543 | 907,619 | 21,847,700.0 |
| LU | Luxembourg | 2,586 | 63,549 | 24,574,245.9 |
| SM | San Marino | 61 | 2,093 | 34,311,475.4 |
| MT | Malta | 316 | 18,404 | 58,240,506.3 |
Sources
US Department of State. 2017. "The World Factbook." Accessed September 21, 2017. https://www.cia.gov/library/publications/the-world-factbook/fields/2147.html.