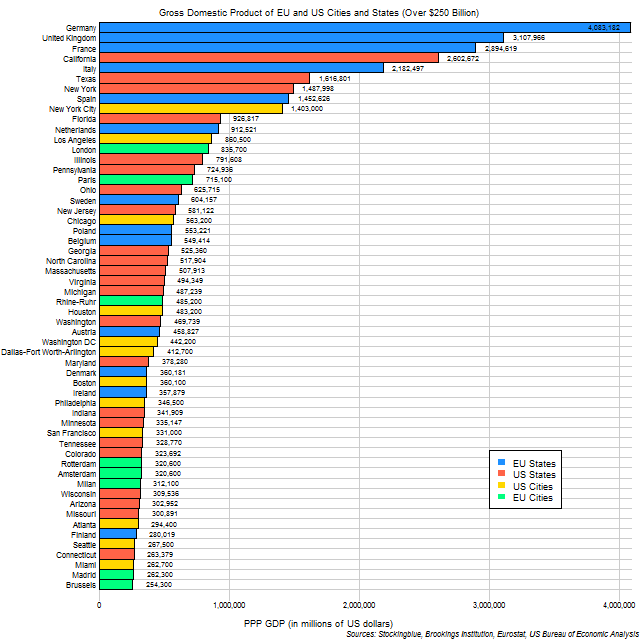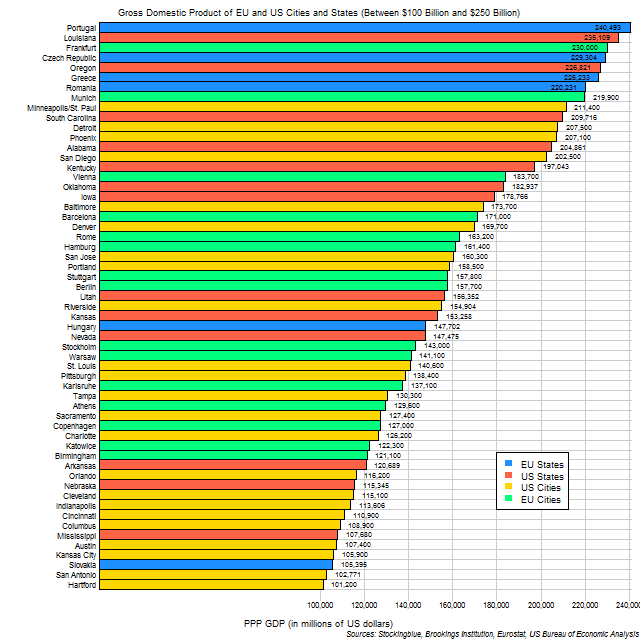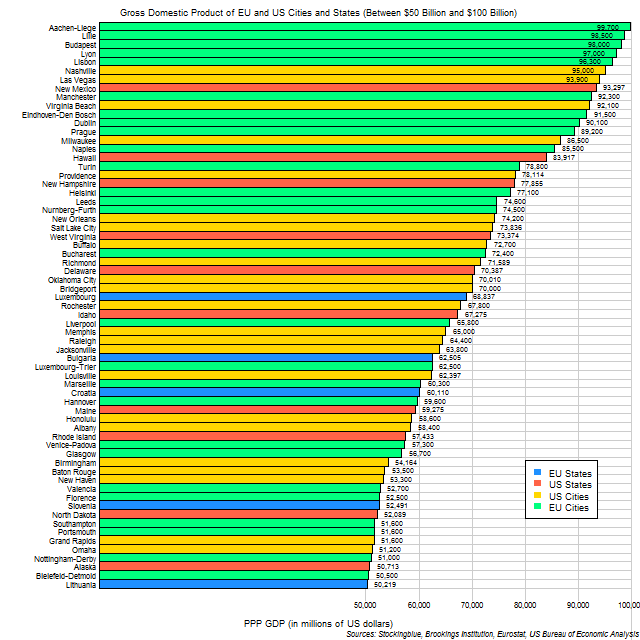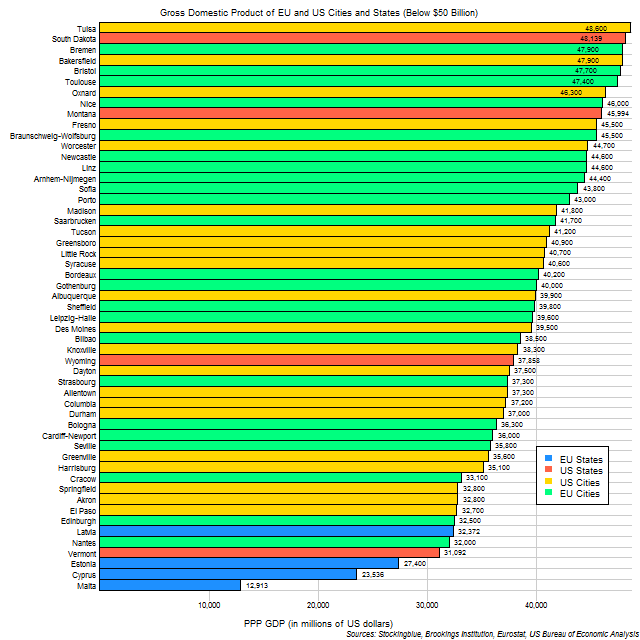
The chart above shows the state and city economies of both the European Union and the United States with GDPs over $250 billion. The EU has the largest state economy but the US has the largest city economy. Below, the remaining states and metropolitan areas that are amongst the 300 largest metropolitan economies in the world with GDPs under $250 billion.
Findings

- Germany, California, the United Kingdom, France, Italy, Texas, New York and Spain are the only states that do not have any EU or US cities with economies larger than them.
- Cities not included in the list (excluding Vilnius, Thessaloniki, and Huntsville) all have smaller GDPs than Malta.
- New York City is the only city in the EU and the US to have a GDP of over $1 trillion.
Caveats

- The data is from 2016.
- State and city data come from two different sources.
- EU State data was converted from euros to dollars at the average 2016 0.77 euros to dollars rate.
- According to their official data, Huntsville ($21.56 billion - 2012), Vilnius ($20 billion - 2014), and Thessaloniki ($19.808 billion - 2011) also have larger economies than Malta but are not among the world's 300 largest urban economies that Brookings looked into and so are not included in the chart.
Details

Only one city cracks the top ten economies in the EU and US. A total of 156 cities (the 153 in the charts and Huntsville, Vilnius, and Thessaloniki) have larger economies than Malta, the state with the smallest GDP.
It takes the five largest metropolitan GDPs (New York City, Los Angeles, London, Paris, and Chicago) to best the largest state GDP (Germany).
Sources
Brookings Institution. "Global Metro Monitor." Accessed December 17, 2017. https://www.brookings.edu/research/global-metro-monitor/.
Eurostat. 2017. "Gross Domestic Product at Market Prices. Accessed October 26, 2017. http://ec.europa.eu/eurostat/tgm/refreshTableAction.do?tab=table&plugin=1&pcode=tec00001&language=en.
US Bureau of Economic Analysis. 2017. "Regional Data." Accessed October 26, 2017. https://bea.gov/itable/iTable.cfm?ReqID=70&step=1#reqid=70&step=1&isuri=1.