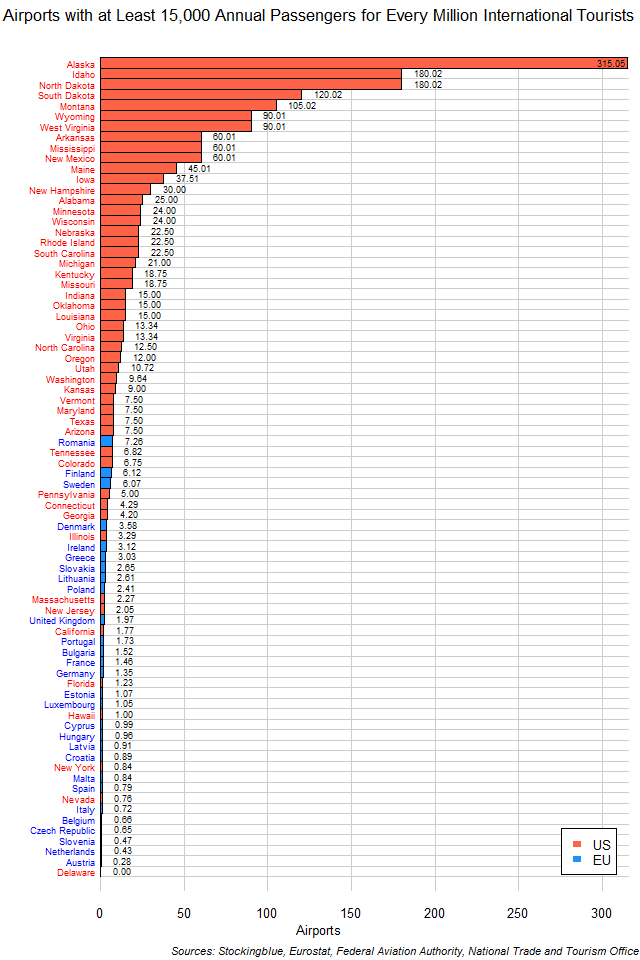
The chart above shows the number of airports that have at least 15,000 annual passengers for every million international tourists each EU or US state receives. At first glance it seems as if US states have far too many airports for the number of international tourists they receive. However, US data does not include interstate tourists whereas EU data does, so this is not really a fair comparison. Still, there are EU states that still manage to surpass US states in this metric.
Findings
- The difference between the state with the greatest number of busy airports per million tourists, Alaska, and the state with the least (which has busy airports), Austria, is 314.76.
- Alaska has 1,133.78 times the number of busy airports per million tourists that Austria does.
- The difference between the US state with the greatest number of busy airports per million tourists, Alaska, and the EU state with the greatest number of busy airports per million tourists, Romania, is 307.79.
- Alaska has 43.41 times the number of busy airports per million tourists that Romania does.
- Delaware is the only state in both the EU and the US without a single busy airport.
- The median number of busy airports per million international tourists in the 28 EU states is 1.21 and the mean 1.99.
- The median number of busy airports per million international tourists in the 50 US states is 14.17 and the mean 35.35.
- The median number of busy airports per million international tourists in the 78 EU and US states is 6.44 and the mean 23.73.
Caveats
- Data for EU airports is from 2016.
- Data for US airports is from 2017.
- Data for EU tourists is from 2012 except for Ireland which is from 2014.
- Data for US tourists is from 2012.
- All figures are rounded to the nearest hundredth.
- Fifteen thousand annual passengers amounts to 41 per day, so busy is loosely defined.
- The data for Idaho, North Dakota, South Dakota, and West Virginia indicates the maximum possible number of tourists as the sample size was too small to be accurate.
- The US tourist data is based on total number of international tourists to the US in 2012 and distributed among the states based on a survey that was conducted on the first quarter of the same year.
Details
This data is misleading as the US data does not include tourists from other US states while the EU data does include data from other EU states. Unfortunately, there is no US data available that includes interstate tourists and international tourists, and there is no data for the EU that excludes interstate travel within the EU. So we'll make due with what we have.
Even with this discrepancy in data, there are still some EU states that surpass US states. Excluding Delaware which does not have any busy airports, only Italy, Belgium, the Czech Republic Slovenia, the Netherlands, and Austria have less busy airports for each international tourist. Seeing as Nevada, the US state with the least airports per international tourist gets a lot of tourists from other states as well, it may have the lowest number if they were factored in.
Alaska is a major outlier due to the unique nature of the state's transportation network. It has a very limited road network which means that travel from one town to another is done exclusively through bush planes, and that is why it has so many busy airports. Even villages make frequent use of air travel.
Although Romania has the highest rate in Europe it still has relatively few airports in the EU for a state its size. Why this is will be explored in future posts that factor in for population and area.
Sources
Eurostat. 2018. "Arrivals at Tourist Accommodation Establishments." Accessed September 18, 2018. http://appsso.eurostat.ec.europa.eu/nui/show.do?query=BOOKMARK_DS-055748_QID_740A02AF_UID_-3F171EB0&layout=TIME,C,X,0;GEO,L,Y,0;C_RESID,L,Z,0;UNIT,L,Z,1;NACE_R2,L,Z,2;INDICATORS,C,Z,3;&zSelection=DS-055748NACE_R2,I551-I553;DS-055748C_RESID,FOR;DS-055748UNIT,NR;DS-055748INDICATORS,OBS_FLAG;&rankName1=C-RESID_1_2_-1_2&rankName2=UNIT_1_2_-1_2&rankName3=INDICATORS_1_2_-1_2&rankName4=NACE-R2_1_2_-1_2&rankName5=TIME_1_0_0_0&rankName6=GEO_1_2_0_1&sortC=ASC_-1_FIRST&rStp=&cStp=&rDCh=&cDCh=&rDM=true&cDM=true&footnes=false&empty=false&wai=false&time_mode=NONE&time_most_recent=false&lang=EN&cfo=%23%23%23%2C%23%23%23.%23%23%23.
Eurostat. 2018. "Number of Commercial Airports (with More Than 15,000 Passenger Units per Year)." Accessed November 25, 2018. http://appsso.eurostat.ec.europa.eu/nui/show.do?query=BOOKMARK_DS-054100_QID_5E0B9564_UID_-3F171EB0&layout=TIME,C,X,0;GEO,L,Y,0;TRA_INFR,L,Z,0;INDICATORS,C,Z,1;&zSelection=DS-054100TRA_INFR,AIRP;DS-054100INDICATORS,OBS_FLAG;&rankName1=TIME_1_0_0_0&rankName2=TRA-INFR_1_2_-1_2&rankName3=GEO_1_2_0_1&rankName4=INDICATORS_1_2_-1_2&sortC=ASC_-1_FIRST&rStp=&cStp=&rDCh=&cDCh=&rDM=true&cDM=true&footnes=false&empty=false&wai=false&time_mode=NONE&time_most_recent=false&lang=EN&cfo=%23%23%23%2C%23%23%23.%23%23%23.
Federal Aviation Authority. 2018. "Enplanements of All Commercial Service Airports (by Rank)." Accessed November 26, 2018. https://www.faa.gov/airports/planning_capacity/passenger_allcargo_stats/passenger/media/cy17-commercial-service-enplanements.pdf.
National Trade and Tourism Office. 2018. "International Visitation in the United States." Accessed September 18, 2018. https://travel.trade.gov/outreachpages/inbound.general_information.inbound_overview.html.
National Trade and Tourism Office. 2018. "Survey of International Air Travelers." Accessed September 18, 2018. https://travel.trade.gov/research/programs/ifs/examples.asp.