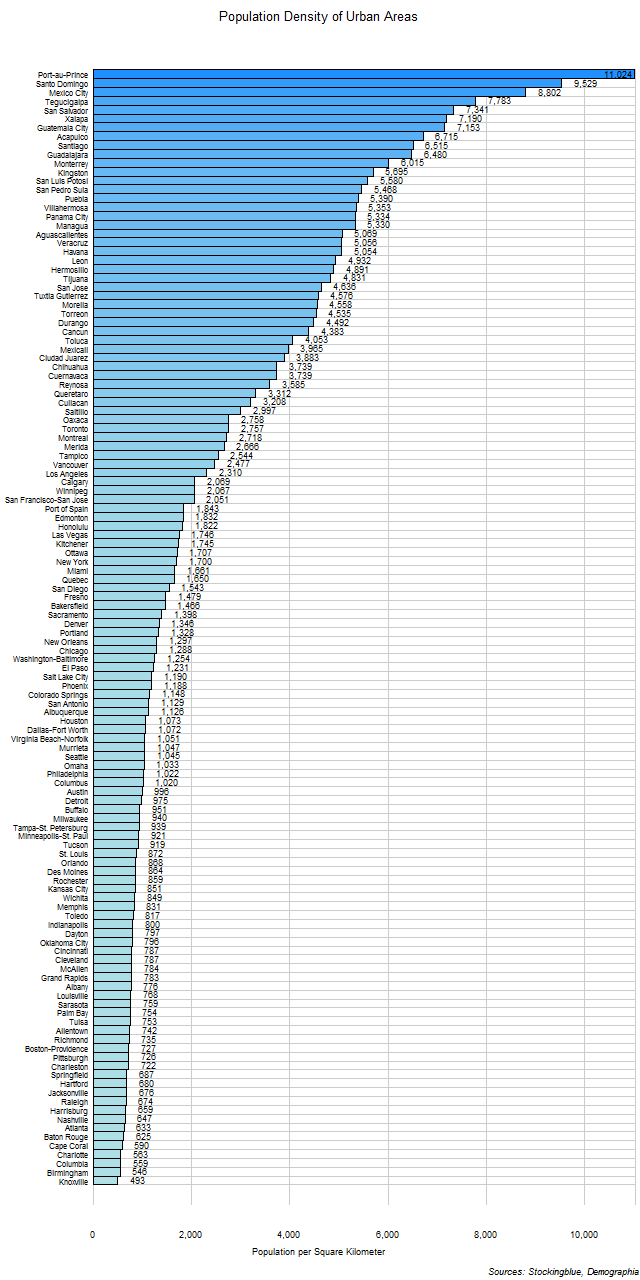
The chart above shows the population density of each urban area with a population of over 500,000. The urban areas have been normalized so as to avoid any inconsistencies with how cities and their metropolitan areas are defined by their governments. Each urban area has similar characteristics making this the definitive method with which to compare cities across various countries. The most densely populated cities in North America are in the Caribbean and Central America.
Findings
- The difference between the urban area with the greatest population density, Port-au-Prince, and the urban area with the least, Knoxville, is 10,531 people per square kilometer (27,275 people per square mile).
- Port-au-Prince has 22.36 times the population density that Knoxville does.
- The median population density of urban areas with a minimum population of 500,000 in North America is 1,337 people per square kilometer (3,463 people per square mile) and the mean 2,496.57 people per square kilometer (6,466 people per square mile).
Caveats
- Data is from 2020.
- The methodology for how these urban areas have been defined can be found in the source link below. As of this writing this is the most reliable way to compare urban areas throughout the world.
- Some of these urban areas span several states, and the state that is being used here is the one where the core of the urban area is located. For instance, Milan's urban area spans both Italy and Switzerland, but since the core of the urban area is in Italy it would be listed as an Italian urban area and not a Swiss one.
- All figures are rounded to the nearest whole.
Details
Only 14 of the 42 North American states have urban areas with at least 500,000 people. Of these, the United States has 74; Mexico has 30; Canada has nine; the Dominican Republic and Honduras each have two and Costa Rica, Cuba, El Salvador, Guatemala, Haiti, Jamaica, Nicaragua, Panama, and Trinidad and Tobago each have one.
All of the 21 urban areas with a population of over 500,000 people that have a population density over 5,000 people per square kilometer (12,950 people per square mile) are located in the Caribbean and Central America. All of the 45 urban areas with a population of over 500,000 people that have a population density less than 1,000 people per square kilometer (2,590 people per square mile) are located in the United States.
Haiti has the largest mean population density in its urban areas of over 500,000 people with a mean of 11,024 people per square kilometer (28,552 people per square mile) distributed among its one urban area. The Dominican Republic has the second largest mean population density in its urban areas of over 500,000 people with a mean of 8,022 people per square kilometer (20,777 people per square mile) distributed among its two urban areas.
Haiti has the largest median population density in its urban areas of over 500,000 people with a median of 11,024 people per square kilometer (28,552 people per square mile) distributed among its one urban area. The Dominican Republic has the second largest median population density in its urban areas of over 500,000 people with a median of 8,022 people per square kilometer (20,777 people per square mile) distributed among its two urban areas.
Anguilla, Antigua and Barbuda, Aruba, the Bahamas, Barbados, Belize, Bermuda, Bonaire, Sint Eustatius and Saba, the British Virgin Islands, the Cayman Islands, Curacao, Dominica, Greenland, Grenada, Guadeloupe, Martinique, Montserrat, Puerto Rico, Saint Barthelemy, Saint Kitts and Nevis, Saint Lucia, Saint Martin, Saint Pierre and Miquelon, Saint Vincent and the Grenadines, Sint Maarten, Turks and Caicos Islands, the US Minor Outlying Islands, and the US Virgin Islands do not have any urban areas with a population of over 500,000 inhabitants.
Sources
Demographia. 2021. "Demographia World Urban Areas: 16th Annual Edition." Accessed March 9, 2021. http://demographia.com/db-worldua.pdf.