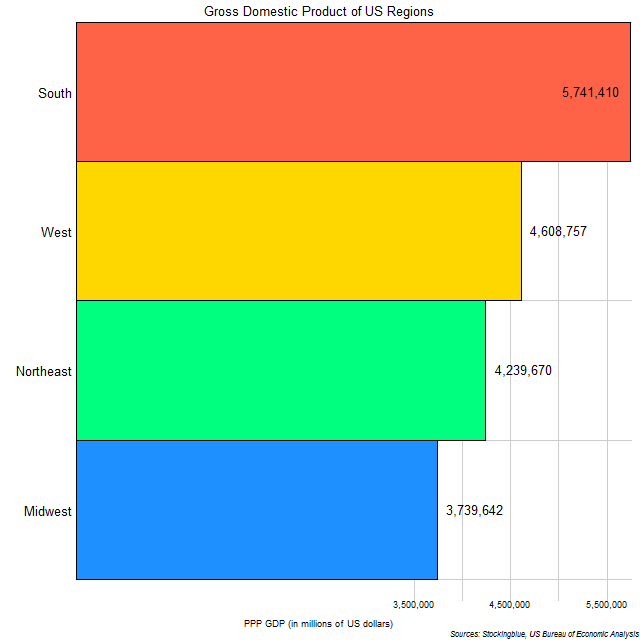
The chart above shows the regional economies of the United States. The largest regional economy, the South, includes 14 states.
Findings
- Only the Midwest is outranked by a region with fewer states.
- Texas accounts for over one-fourth of the South's GDP.
- California accounts for over one-half of the West's GDP.
- New York accounts for over one-third of the Northeast's GDP.
- Illinois accounts for over one-fifth of the Midwest's GDP.
Caveats
- The data is from 2016.
- The South consists of (in descending order of GDP) Texas, Florida, Georgia, North Carolina, Virginia, Tennessee, Louisiana, South Carolina, Alabama, Kentucky, Oklahoma, Arkansas, Mississippi, and West Virginia.
- The West consists of (in descending order of GDP) California, Washington, Colorado, Arizona, Oregon, Utah, Nevada, New Mexico, Hawaii, Idaho, Alaska, Montana, and Wyoming.
- The Northeast consists of (in descending order of GDP) New York, Pennsylvania, New Jersey, Massachusetts, Maryland, Connecticut, New Hampshire, Delaware, Maine, Rhode Island, and Vermont.
- The Midwest consists of (in descending order of GDP) Illinois, Ohio, Michigan, Indiana, Minnesota, Wisconsin, Missouri, Iowa, Kansas, Nebraska, North Dakota, and South Dakota.
Details
Each of the four regions have relatively similar sized economies and they each have one state that dominates the region's economy.
According to this data, the total PPP GDP for the US is $18,329,479,000,000.
Sources
US Bureau of Economic Analysis. 2017. "Regional Data." Accessed October 26, 2017. https://bea.gov/itable/iTable.cfm?ReqID=70&step=1#reqid=70&step=1&isuri=1.