Air Travel per Capita in US States
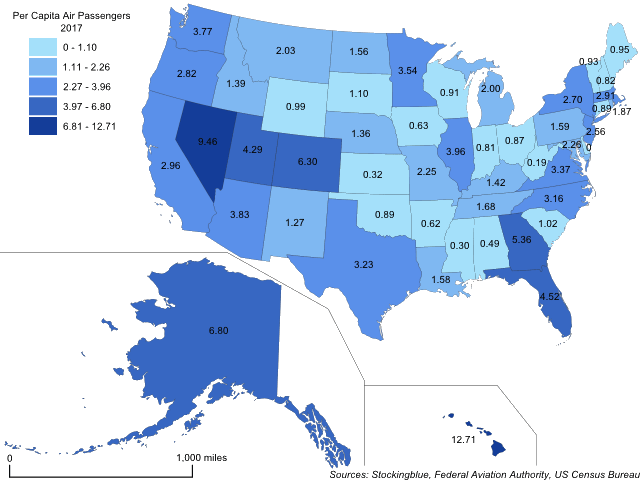
The map above shows the number of passengers that traveled by air for every resident in each US state. Hawaii is the only state to have more than ten air passengers for every resident in the state.
Air Travel per Capita in EU States
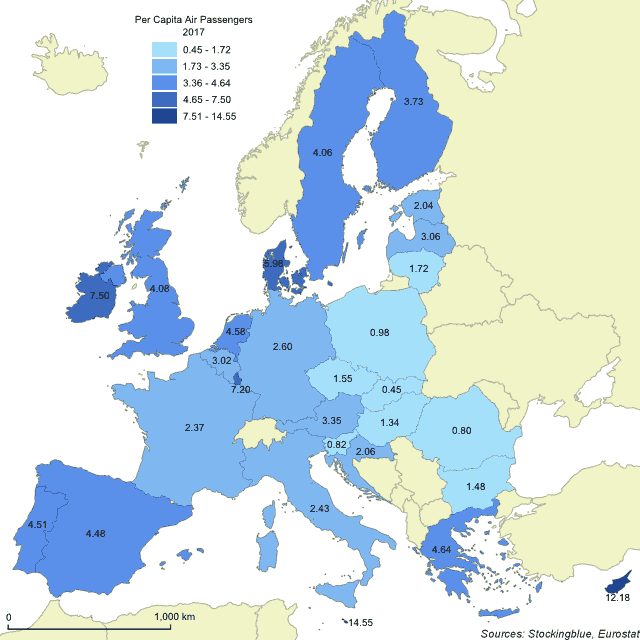
The map above shows the number of passengers that traveled by air for every resident in each EU state. The two island states of Cyprus and Malta have a commanding lead over all other EU states and are the only two states with more than ten air passengers for every inhabitant.
Busy Commercial Airports per Million People in EU and US States
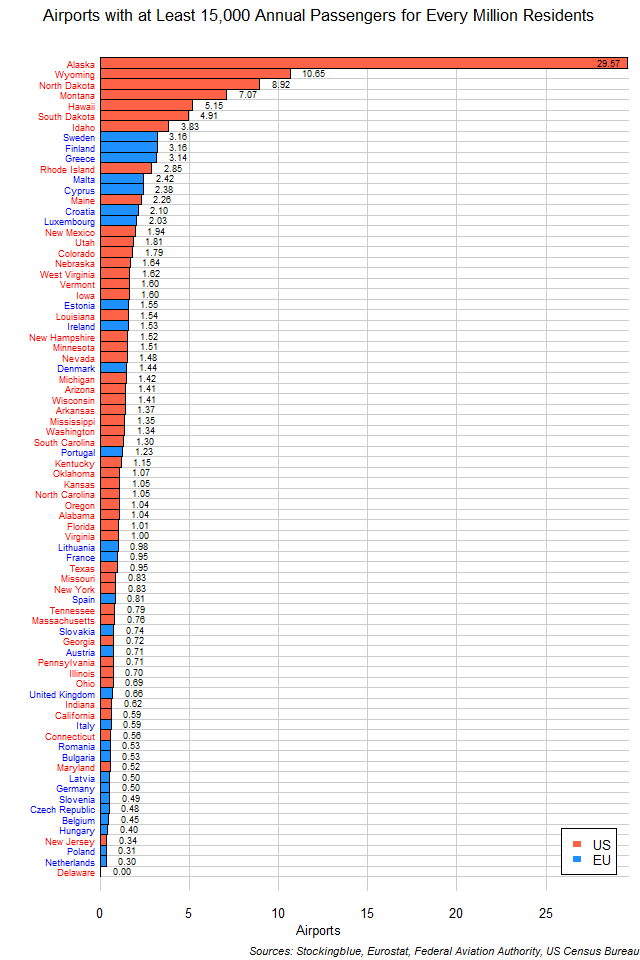
The chart above shows the number of airports that have at least 15,000 annual passengers for every million inhabitants in EU and US states. In both the EU and the US, large states with small populations have more airports per capita.
Busy Commercial Airports per Million People in US States
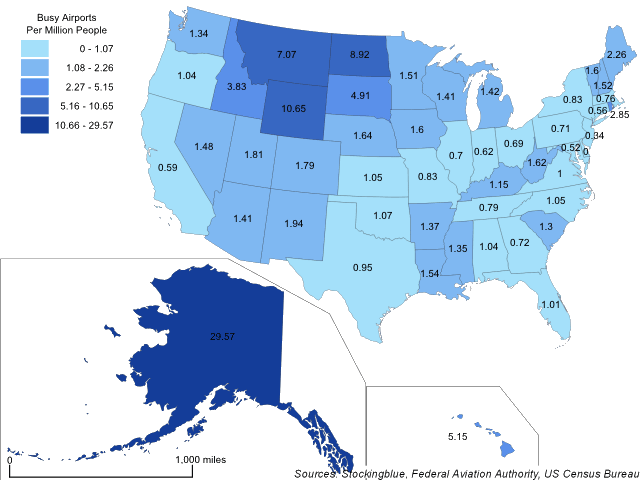
The map above shows the number of airports that serve at least 15,000 passengers per year for every million residents in each US state. Alaska has the most airports per capita by a large margin.
Busy Commercial Airports per Million People in EU States
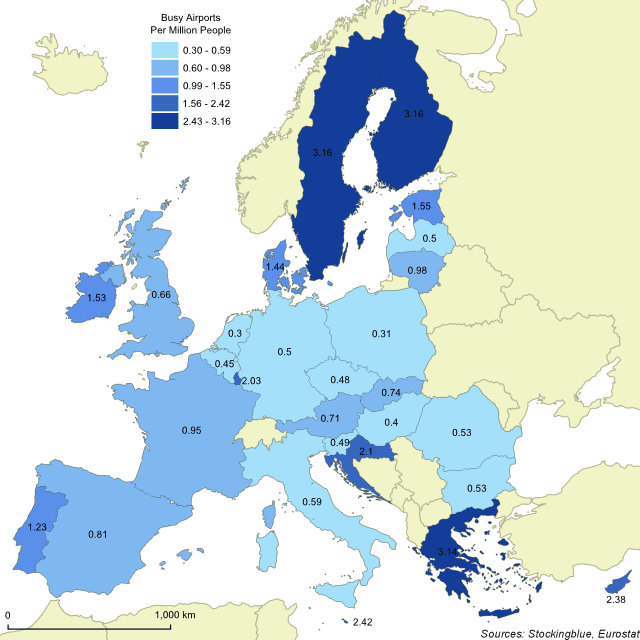
The map above shows the number of airports that serve at least 15,000 passengers per year for every million residents in each EU state. Sweden has the most busy airports per capita.
The 2018 New York Gubernatorial Results Based on County Population
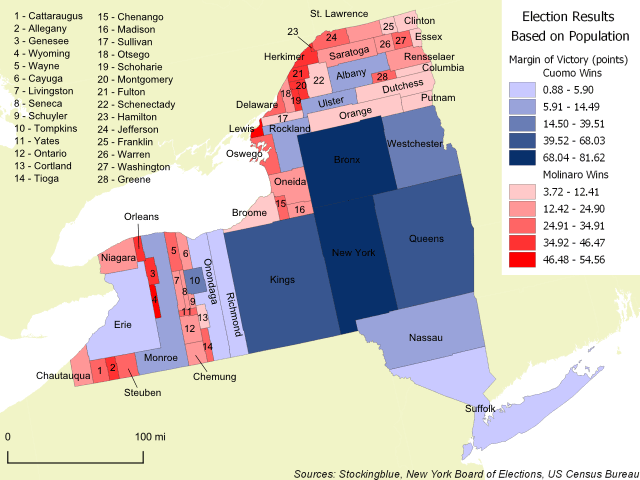
The geographically accurate cartogram above shows the 2018 gubernatorial results in New York based on county populations. The larger the county on this map, the larger its population. The map shows that even though Andrew Cuomo only won 15 of the 62 counties in the state, those 15 counties make up such a large chunk of the state's population that he could afford to lose 47 counties.
Cartogram of Population in Alaska
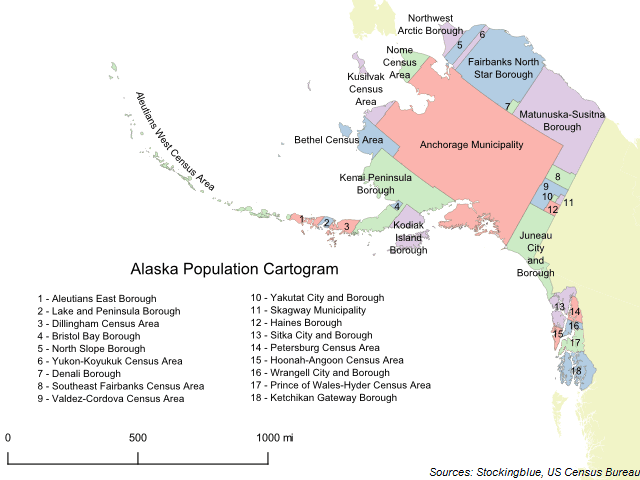
The geographically accurate cartogram above represents the size of the boroughs and census areas of Alaska based on their population. Anchorage makes up nearly half (41.09%) of the state's population and thus takes up a significantly larger portion of the state's landmass than it currently does.
Cartogram of Population in New York State
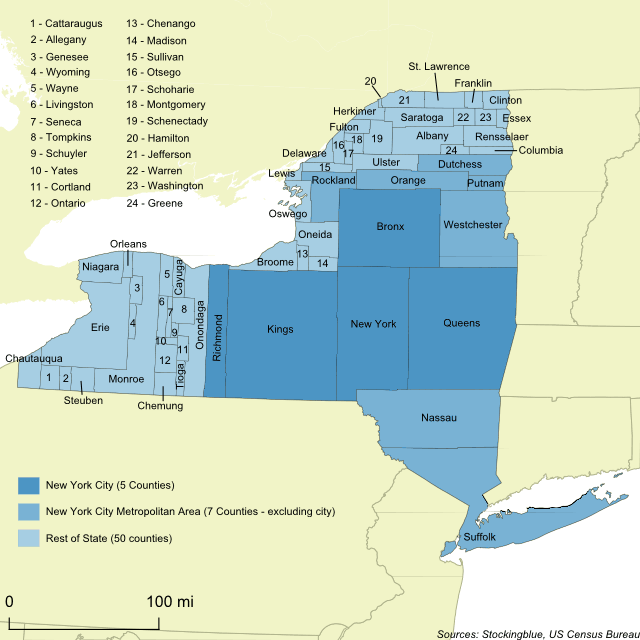
The geographically accurate cartogram above represents the size of the counties based on their population. New York City makes up nearly half (42.19%) of the state's population and thus takes up a much larger portion of the state's landmass than it currently does.
Per Capita Waterway Coverage in EU and US Regions
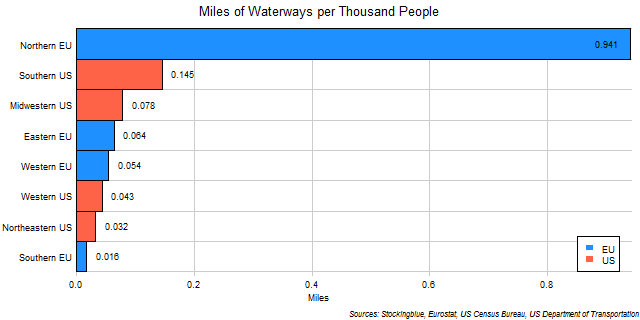
The chart above shows the miles of waterways per thousand people in EU and US regions. Although the Southern US has almost twice as many miles of waterways per capita as the third highest ranked region, the Northern EU has six times as many waterways per capita as the Southern US does.
Per Capita Waterway Coverage in US Regions

The chart above shows the miles of waterways per thousand people in US regions. The South has almost twice as many miles of waterways per capita as the region just below it.
OlderNewer