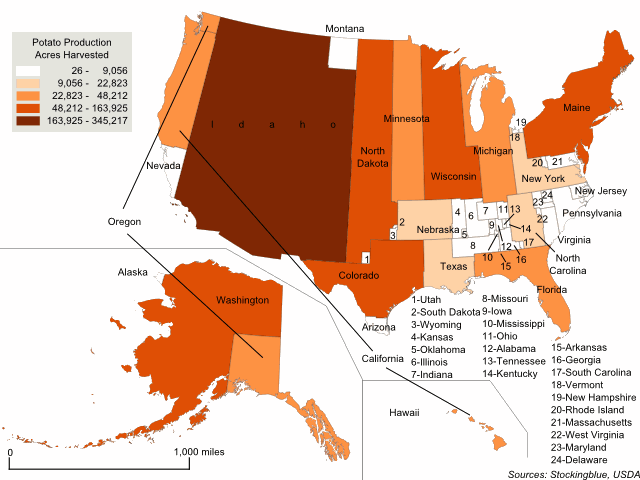
This week, the focus is on common Thanksgiving foods and which states produce them. The geographically accurate cartogram above redraws the states' sizes based on potato production. Specifically the number of acres harvested. All 50 states produce the crop but there is one clear leader in the production of potatoes accounting for nearly one-third of the acres dedicated to the root: Idaho.
Findings
- Of the states data is available for, Idaho harvests the most acres of potatoes accounting for just under one-third of the nation's total acreage dedicated to the crop.
- Hawaii harvests only 0.002 percent of the total acreage dedicated to potatoes in the nation.
- The second largest turkey producing state, Washington, makes up 14 percent of the total and is the only other state besides Idaho who is responsible for more than 10 percent of the nations acreage dedicated to producing potatoes.
Caveats
- The agriculture census data is from 2012.
- The following states do produce potatoes but the USDA does not release production numbers because there are few operators in the state. It could be that these three states are the largest or the smallest producers or anything in between. The states whose data was not released are Connecticut, Louisiana, and New Mexico.
- The choropleth classification is based on Jenks or natural breaks.
Details
This is clearly a northern crop as all the states with the greatest acreage dedicated to growing it are northern states.
The total reported area dedicated to the crop in the United States is 1,161,530 acres (470,054.5 hectares) or 1,814.89 square miles (4,700.55 square kilometers).
Data
| State | Acres Harvested | Percent of US Total |
|---|---|---|
| Idaho | 345,217 | 29.72 |
| Washington | 163,925 | 14.11 |
| North Dakota | 85,844 | 7.39 |
| Wisconsin | 66,400 | 5.72 |
| Maine | 61,336 | 5.28 |
| Colorado | 59,281 | 5.1 |
| Minnesota | 48,212 | 4.15 |
| Michigan | 46,662 | 4.02 |
| California | 42,660 | 3.67 |
| Oregon | 41,667 | 3.59 |
| Florida | 35,251 | 3.03 |
| Nebraska | 22,823 | 1.96 |
| Texas | 22,535 | 1.94 |
| New York | 21,865 | 1.88 |
| North Carolina | 16,293 | 1.4 |
| Missouri | 9,056 | 0.78 |
| Montana | 8,682 | 0.75 |
| Pennsylvania | 8,659 | 0.75 |
| Nevada | 7,273 | 0.63 |
| Illinois | 7,021 | 0.6 |
| Virginia | 5,423 | 0.47 |
| Kansas | 5,178 | 0.45 |
| Massachusetts | 3,898 | 0.34 |
| Georgia | 3,634 | 0.31 |
| Indiana | 3,539 | 0.3 |
| Arizona | 3,389 | 0.29 |
| New Jersey | 2,427 | 0.21 |
| Maryland | 2,266 | 0.2 |
| Ohio | 2,074 | 0.18 |
| Delaware | 1,363 | 0.12 |
| Iowa | 1,028 | 0.09 |
| Utah | 981 | 0.08 |
| Wyoming | 865 | 0.07 |
| Alabama | 808 | 0.07 |
| Alaska | 676 | 0.06 |
| Rhode Island | 558 | 0.05 |
| Oklahoma | 489 | 0.04 |
| Kentucky | 360 | 0.03 |
| Tennessee | 359 | 0.03 |
| West Virginia | 335 | 0.03 |
| South Carolina | 308 | 0.03 |
| Vermont | 267 | 0.02 |
| Mississippi | 229 | 0.02 |
| New Hampshire | 172 | 0.01 |
| South Dakota | 156 | 0.01 |
| Arkansas | 60 | 0.01 |
| Hawaii | 26 | 0 |
| Connecticut | not reported | no data |
| Louisiana | not reported | no data |
| New Mexico | not reported | no data |
Sources
United States Department of Agriculture. 2017. "USDA/NASS QuickStats Ad-Hoc Query Tool." Accessed November 19, 2017. https://quickstats.nass.usda.gov/?source_desc=CENSUS.