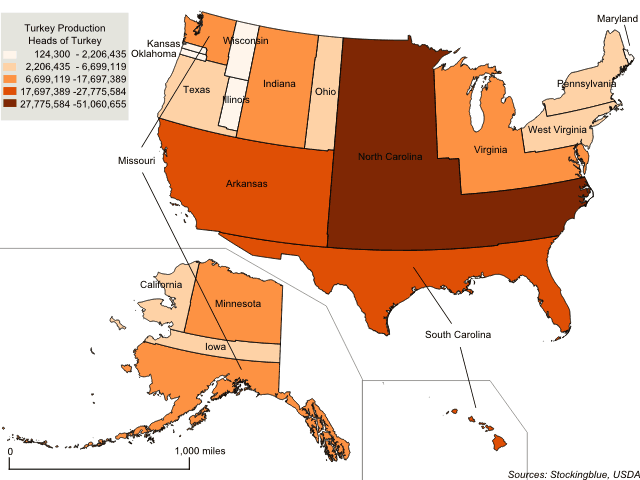
This week, the focus is on common Thanksgiving foods and which states produce them. The geographically accurate cartogram above redraws the states' sizes based on turkey production. Specifically the number of heads of turkey. Only 24 states produce the bird and of the 24, the USDA publishes data on only 18 of them due to the other six states having few producers which would make it easy for their competitors to know how large their operations are.
Findings
- Of the states data is available for, North Carolina has the most heads of turkey making up over one-quarter of the total heads of turkey in the nation.
- Maryland only has 0.03 percent of the total heads of turkey in the nation.
- The second largest turkey producing state only makes up 14 percent of the total.
Caveats
- The agriculture census data is from 2012.
- The following states do produce turkeys but the USDA does not release production numbers for them and thus do not show up on the map: Kentucky, Michigan, Nebraska, New York, South Dakota, and Utah.
- The following states were not listed as turkey producing states and thus do not show up on the map: Maine, New Hampshire, Vermont, Massachusetts, Rhode Island, Connecticut, New Jersey, Delaware, Tennessee, Georgia, Florida, Alabama, Mississippi, Louisiana, North Dakota, Montana, Wyoming, Colorado, New Mexico, Arizona, Nevada, Idaho, Washington, Oregon, Alaska, and Hawaii.
- The choropleth classification is based on Jenks or natural breaks.
Details
Unlike pumpkin production which primarily takes place in northern states, the South dominates in the number of turkeys being raised. Southern states are responsible for nearly three out of every four turkeys in production.
An interesting note is that of the states that the USDA released figures for, the turkey population in the country is only 195,473,356. There are more people than turkeys in this country even though at times it doesn't seem very likely that that is the case.
Data
| State | Number of Turkey Heads | Percent of US Total |
|---|---|---|
| North Carolina | 51,060,655 | 26.12 |
| Arkansas | 27,775,584 | 14.21 |
| South Carolina | 23,869,524 | 12.21 |
| Virginia | 17,697,389 | 9.05 |
| Missouri | 16,108,706 | 8.24 |
| Indiana | 12,115,276 | 6.2 |
| Minnesota | 10,857,330 | 5.55 |
| Texas | 6,699,119 | 3.43 |
| Iowa | 6,412,283 | 3.28 |
| Ohio | 5,204,116 | 2.66 |
| Pennsylvania | 4,884,688 | 2.5 |
| West Virginia | 4,563,479 | 2.33 |
| California | 3,676,925 | 1.88 |
| Wisconsin | 2,206,435 | 1.13 |
| Illinois | 1,680,558 | 0.86 |
| Oklahoma | 279,889 | 0.14 |
| Kansas | 257,100 | 0.13 |
| Maryland | 124,300 | 0.06 |
| Kentucky | Not reported | No data |
| Michigan | Not reported | No data |
| Nebraska | Not reported | No data |
| New York | Not reported | No data |
| South Dakota | Not reported | No data |
| Utah | Not reported | No data |
Sources
United States Department of Agriculture. 2017. "USDA/NASS QuickStats Ad-Hoc Query Tool." Accessed November 19, 2017. https://quickstats.nass.usda.gov/?source_desc=CENSUS.