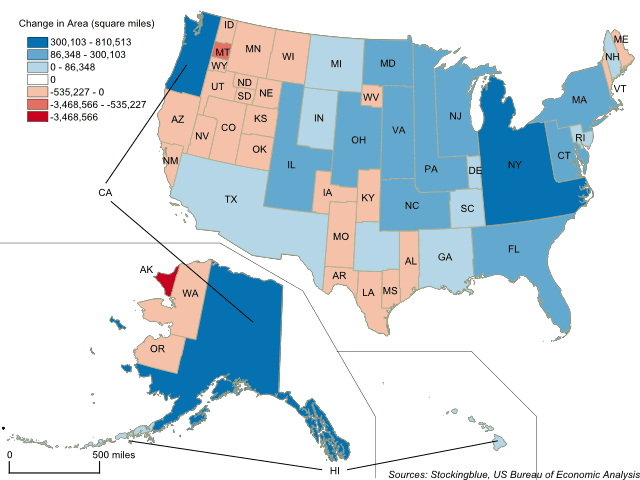
The geographically accurate cartogram above represents the states' boundaries based on gross domestic product. California, New York, and Texas take up large swaths of the country while Alaska nearly loses all of its territory.
Findings
- New Jersey gains the most territory percentage-wise as it grows by 1,022 percent.
- California gains the most land and surpass Texas and Alaska to become the largest state in the Union.
- Alaska shrinks the most percentage-wise losing 99 percent of its territory, as well as in absolute terms and becomes the sixth smallest state.
- Vermont becomes the smallest state in the Union.
Caveats
- The GDP data is from 2016.
- The borders represent the area of the state if it were based on GDP. The location of the states on the map is irrelevant.
Details
Several states grow to more than twice their size including (in descending order of growth) New Jersey, Massachusetts, Connecticut, Rhode Island, Maryland, Delaware, New York, Florida, California, Hawaii, Pennsylvania, Ohio, and Illinois.
The states that cede more than half of their territory are (in descending order of growth) Iowa, Colorado, Vermont, West Virginia, Arizona, Oklahoma, Arkansas, Mississippi, Oregon, Kansas, Utah, Maine, Nebraska, Nevada, New Mexico, Idaho, North Dakota, South Dakota, Wyoming, Montana, and Alaska.
Data
| State | GDP (in millions) | Existing Area (sq km) | Projected Area (based on GDP) | Percent Change in Area |
|---|---|---|---|---|
| Alaska | 50,713 | 3,494,728 | 26,162 | -99 |
| Montana | 45,994 | 558,614 | 23,387 | -96 |
| Wyoming | 37,858 | 346,628 | 19,684 | -94 |
| South Dakota | 48,139 | 279,790 | 24,274 | -91 |
| North Dakota | 52,089 | 270,639 | 26,135 | -90 |
| Idaho | 67,275 | 303,070 | 34,541 | -89 |
| New Mexico | 93,297 | 382,825 | 47,676 | -88 |
| Nevada | 147,475 | 371,012 | 74,751 | -80 |
| Nebraska | 115,345 | 267,846 | 58,867 | -78 |
| Maine | 59,275 | 120,862 | 29,951 | -75 |
| Utah | 156,352 | 284,705 | 79,408 | -72 |
| Kansas | 153,258 | 272,678 | 78,513 | -71 |
| Oregon | 226,821 | 349,188 | 115,875 | -67 |
| Arkansas | 120,689 | 168,351 | 61,669 | -63 |
| Mississippi | 107,680 | 147,284 | 55,173 | -63 |
| Oklahoma | 182,937 | 223,118 | 93,488 | -58 |
| Arizona | 302,952 | 358,367 | 154,172 | -57 |
| Colorado | 323,692 | 347,462 | 161,415 | -54 |
| Vermont | 31,092 | 34,672 | 15,862 | -54 |
| West Virginia | 73,374 | 80,471 | 37,387 | -54 |
| Iowa | 178,766 | 196,503 | 91,578 | -53 |
| Minnesota | 335,147 | 316,470 | 171,020 | -46 |
| Alabama | 204,861 | 159,756 | 104,674 | -34 |
| Missouri | 300,891 | 230,683 | 153,209 | -34 |
| Kentucky | 197,043 | 132,204 | 100,897 | -24 |
| Wisconsin | 309,536 | 204,348 | 157,896 | -23 |
| Louisiana | 235,109 | 143,056 | 119,605 | -16 |
| Washington | 469,739 | 258,988 | 239,277 | -8 |
| Texas | 1,616,801 | 809,540 | 824,153 | 2 |
| South Carolina | 209,716 | 97,356 | 106,574 | 9 |
| Michigan | 487,239 | 211,349 | 248,552 | 18 |
| New Hampshire | 77,855 | 33,255 | 39,219 | 18 |
| Tennessee | 328,770 | 134,940 | 167,252 | 24 |
| Indiana | 341,909 | 122,349 | 174,764 | 43 |
| Georgia | 525,360 | 181,772 | 268,120 | 48 |
| North Carolina | 517,904 | 158,397 | 264,413 | 67 |
| Virginia | 494,349 | 132,418 | 252,335 | 91 |
| Illinois | 791,608 | 190,941 | 403,686 | 111 |
| Ohio | 625,715 | 140,276 | 318,604 | 127 |
| Pennsylvania | 724,936 | 155,346 | 370,002 | 138 |
| Hawaii | 83,917 | 17,947 | 42,945 | 139 |
| California | 2,602,672 | 516,352 | 1,326,865 | 157 |
| Florida | 926,817 | 172,681 | 472,784 | 174 |
| New York | 1,487,998 | 173,574 | 758,777 | 337 |
| Delaware | 70,387 | 6,711 | 35,521 | 429 |
| Maryland | 378,280 | 34,354 | 192,463 | 460 |
| Rhode Island | 57,433 | 3,814 | 29,006 | 661 |
| Connecticut | 263,379 | 17,311 | 134,521 | 677 |
| Massachusetts | 507,913 | 28,731 | 258,812 | 801 |
| New Jersey | 581,122 | 26,405 | 296,178 | 1,022 |
Sources
US Bureau of Economic Analysis. 2017. "Regional Data." Accessed October 26, 2017. https://bea.gov/itable/iTable.cfm?ReqID=70&step=1#reqid=70&step=1&isuri=1.