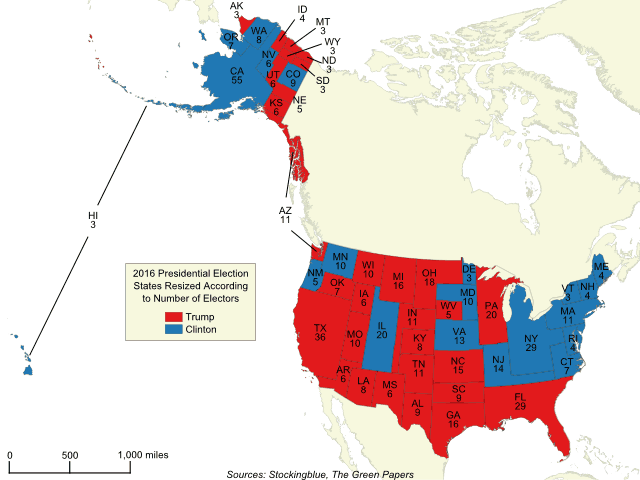
The geographically accurate cartogram above represents the 2016 presidential election with states resized according to the number of electors they have. The more electors a state has, the larger it is on the map. Compared to traditional maps, this map shows the electoral vote in a more accurate way painting the entirety of the United States with the appropriate amount of each color.
Findings
- The Northeast is considerably larger on this map as so many electors are distributed among these states.
- States west of the Mississippi River (with few exceptions) have very few electors and are squeezed together at the far western edge of the country.
Caveats
- The borders represent the area of the state if it were based on electors. The location of the states on the map is irrelevant.
Details
The significance of carrying California, Texas, Florida, and New York really comes through in a map like this.
Even states with few electors can prove to be critical if they are close to each other and have similar characteristics.
Data
| State | Clinton Votes | Percent Clinton | Clinton Electors | Trump Votes | Percent Trump | Trump Electors |
|---|---|---|---|---|---|---|
| Alabama | 729,547 | 34.36 | 0 | 1,318,255 | 62.08 | 9 |
| Alaska | 116,454 | 36.55 | 0 | 163,387 | 51.28 | 3 |
| Arizona | 1,161,167 | 45.13 | 0 | 1,252,401 | 48.67 | 11 |
| Arkansas | 380,494 | 33.65 | 0 | 684,872 | 60.57 | 6 |
| California | 8,753,788 | 61.73 | 55 | 4,483,810 | 31.62 | 0 |
| Colorado | 1,338,870 | 48.16 | 9 | 1,202,484 | 43.25 | 0 |
| Connecticut | 897,572 | 54.57 | 7 | 673,215 | 40.93 | 0 |
| Delaware | 235,603 | 53.09 | 3 | 185,127 | 41.72 | 0 |
| District of Columbia | 282,830 | 90.48 | 3 | 12,723 | 4.07 | 0 |
| Florida | 4,504,975 | 47.82 | 0 | 4,617,886 | 49.02 | 29 |
| Georgia | 1,877,963 | 45.64 | 0 | 2,089,104 | 50.77 | 16 |
| Hawaii | 266,891 | 62.22 | 3 | 128,847 | 30.03 | 0 |
| Idaho | 189,765 | 27.49 | 0 | 409,055 | 59.26 | 4 |
| Illinois | 3,090,729 | 55.83 | 20 | 2,146,015 | 38.76 | 0 |
| Indiana | 1,033,126 | 37.91 | 0 | 1,557,286 | 56.82 | 11 |
| Iowa | 653,669 | 41.74 | 0 | 800,983 | 51.15 | 6 |
| Kansas | 427,005 | 36.05 | 0 | 671,018 | 56.65 | 6 |
| Kentucky | 628,854 | 32.68 | 0 | 1,202,971 | 62.52 | 8 |
| Louisiana | 780,154 | 38.45 | 0 | 1,178,638 | 58.09 | 8 |
| Maine | 357,735 | 47.83 | 4 | 335,593 | 44.87 | 0 |
| Maryland | 1,677,928 | 60.33 | 10 | 943,169 | 33.91 | 0 |
| Massachusetts | 1,995,196 | 60.01 | 11 | 1,090,893 | 32.81 | 0 |
| Michigan | 2,268,839 | 47.27 | 0 | 2,279,543 | 47.50 | 16 |
| Minnesota | 1,367,716 | 46.44 | 10 | 1,322,951 | 44.92 | 0 |
| Mississippi | 485,131 | 40.11 | 0 | 700,714 | 57.94 | 6 |
| Missouri | 1,071,068 | 38.14 | 0 | 1,594,511 | 56.77 | 10 |
| Montana | 177,709 | 35.75 | 0 | 279,240 | 56.17 | 3 |
| Nebraska | 284,494 | 33.70 | 0 | 495,961 | 58.75 | 5 |
| Nevada | 539,260 | 47.92 | 6 | 512,058 | 45.50 | 0 |
| New Hampshire | 348,526 | 46.98 | 4 | 345,790 | 46.61 | 0 |
| New Jersey | 2,148,278 | 54.99 | 14 | 1,601,933 | 41.00 | 0 |
| New Mexico | 385,234 | 48.26 | 5 | 319,667 | 40.04 | 0 |
| New York | 4,556,124 | 59.01 | 29 | 2,819,534 | 36.52 | 0 |
| North Carolina | 2,189,316 | 46.17 | 0 | 2,362,631 | 49.83 | 15 |
| North Dakota | 93,758 | 27.23 | 0 | 216,794 | 62.96 | 3 |
| Ohio | 2,394,164 | 43.56 | 0 | 2,841,005 | 51.69 | 18 |
| Oklahoma | 420,375 | 28.93 | 0 | 949,136 | 65.32 | 7 |
| Oregon | 1,002,106 | 50.07 | 7 | 782,403 | 39.09 | 0 |
| Pennsylvania | 2,926,441 | 47.46 | 0 | 2,970,733 | 48.18 | 20 |
| Rhode Island | 252,525 | 54.41 | 4 | 180,543 | 38.90 | 0 |
| South Carolina | 855,373 | 40.67 | 0 | 1,155,389 | 54.94 | 9 |
| South Dakota | 117,458 | 31.74 | 0 | 227,721 | 61.53 | 3 |
| Tennessee | 870,695 | 34.72 | 0 | 1,522,925 | 60.72 | 11 |
| Texas | 3,877,868 | 43.24 | 0 | 4,685,047 | 52.23 | 36 |
| Utah | 310,676 | 27.46 | 0 | 515,231 | 45.54 | 6 |
| Vermont | 178,573 | 56.68 | 3 | 95,369 | 30.27 | 0 |
| Virginia | 1,981,473 | 49.73 | 13 | 1,769,443 | 44.41 | 0 |
| Washington | 1,742,718 | 52.54 | 8 | 1,221,747 | 36.83 | 0 |
| West Virginia | 188,794 | 26.43 | 0 | 489,371 | 68.50 | 5 |
| Wisconsin | 1,382,536 | 46.45 | 0 | 1,405,284 | 47.22 | 10 |
| Wyoming | 55,973 | 21.63 | 0 | 174,419 | 67.40 | 3 |
Sources
The Green Papers. 2017. "2016 Presidential Election by State." Accessed November 14, 2017. http://www.thegreenpapers.com/G16/President-Details.phtml.