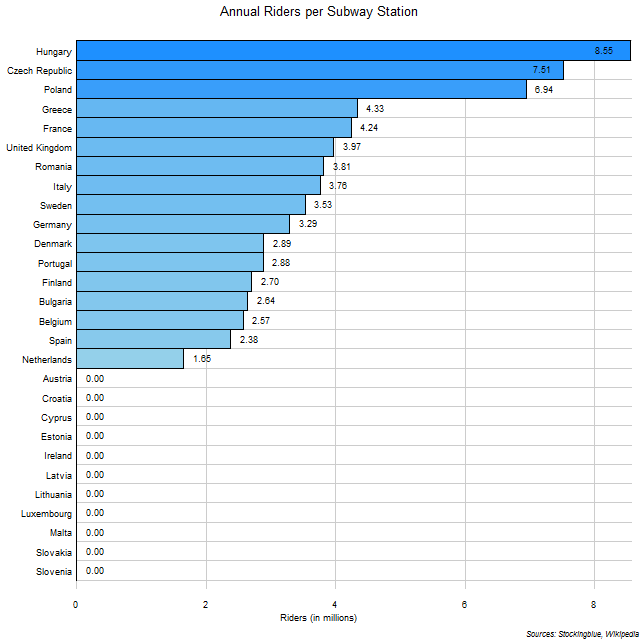
The chart above shows the number of annual riders for every subway station in each EU state. One million annual riders is the equivalent of 2,740 riders a day. So the Netherlands has 4,521 daily riders for every station while Hungary has 23,425.
Findings
- The difference between the state with the most annual riders per subway station, Hungary, and the state with the least (that has a subway system), the Netherlands, is 6.9 million.
- Hungary has 5.18 times the annual riders per subway station that the Netherlands does.
- Italy has seven subway systems, France has six, the United Kingdom and Germany each have four, Spain has three, and the Netherlands has two, all other states have one.
- The median number of annual riders per station in states that have a subway is 3.53 million and the mean 3.98 million.
Caveats
- Data is from 2017.
- Greece is currently working on building a subway system for Thessaloniki which is expected to have 3.44 million annual riders per station which would bring Greece down to 4.01 million riders per station.
- All figures are rounded to the nearest hundredth.
Details
Even though France has the most subway stations in the EU and the most subway ridership, it only ranks fifth in the number of riders per station. It has ten times as many stations as Hungary does, the leader in this metric, but only five times as many riders.
Italy has seven heavy rail systems. The Milan Metro has 5.37 million annual riders per station, the Rome Metro has 3.82, the Naples Metro has 1.93, the Turin Metro has 1.96, the Brescia Metro has 1.02, the Catania Metro has 0.58, and the Genoa Metro has 1.38. France has 5.03 million annual riders per station in the Paris Metro, 1.79 in the Lille Metro, 4.96 in the Lyon Metro, 3.00 in the Toulouse Metro, 2.71 in the Marseille Metro, and 2.29 in the Rennes Metro. The United Kingdom has two systems in London, one in Newcastle, and one in Glasgow. The London Underground has 5.10 million annual riders per station, the Tyne and Wear Metro in Newcastle has 0.73, the Docklands Light Railway in London has 2.72, and the Glasgow Subway has 0.76. Germany has 3.25 million annual riders per station in the Berlin U-Bahn, 4.27 in the Munich U-Bahn, 2.64 in the Hamburg U-Bahn, and 2.68 in the Nuremberg U-Bahn. Spain has 2.60 in the Madrid Metro, 2.15 in the Barcelona Metro, and 2.15 in the Metro Bilbao. The Netherlands has 1.50 million annual riders per station in the Rotterdam Metro and 1.89 in the Amsterdam Metro.
Data
| State | City | Name | Stations | Riders (in millions) |
|---|---|---|---|---|
| Belgium | Brussels | Brussels Metro | 59 | 151.6 |
| Bulgaria | Sofia | Sofia Metro | 34 | 89.7 |
| Czech Republic | Prague | Prague Metro | 58 | 435.6 |
| Denmark | Copenhagen | Copenhagen Metro | 22 | 63.5 |
| Finland | Helsinki | Helsinki Metro | 25 | 67.5 |
| France | Lille | Lille Metro | 60 | 107.5 |
| France | Lyon | Lyon Metro | 40 | 198.2 |
| France | Marseille | Marseille Metro | 28 | 75.9 |
| France | Paris | Paris Metro | 302 | 1,518.6 |
| France | Rennes | Rennes Metro | 15 | 34.3 |
| France | Toulouse | Toulouse Metro | 37 | 110.9 |
| Germany | Berlin | Berlin U-Bahn | 173 | 563 |
| Germany | Hamburg | Hamburg U-Bahn | 92 | 242.5 |
| Germany | Munich | Munich U-Bahn | 96 | 410 |
| Germany | Nuremberg | Nuremberg U-Bahn | 48 | 128.85 |
| Greece | Athens | Athens Metro | 61 | 264.4 |
| Hungary | Budapest | Budapest Metro | 48 | 410.6 |
| Italy | Brescia | Brescia Metro | 17 | 17.4 |
| Italy | Catania | Catania Metro | 10 | 5.8 |
| Italy | Genoa | Genoa Metro | 8 | 11 |
| Italy | Milan | Milan Metro | 106 | 569.5 |
| Italy | Naples | Naples Metro | 22 | 42.5 |
| Italy | Rome | Rome Metro | 73 | 279 |
| Italy | Turin | Turin Metro | 21 | 41.1 |
| Netherlands | Amsterdam | Amsterdam Metro | 39 | 73.7 |
| Netherlands | Rotterdam | Rotterdam Metro | 62 | 93 |
| Poland | Warsaw | Warsaw Metro | 27 | 187.3 |
| Portugal | Lisbon | Lisbon Metro | 56 | 161.5 |
| Romania | Bucharest | Bucharest Metro | 47 | 179.1 |
| Spain | Barcelona | Barcelona Metro | 182 | 390.4 |
| Spain | Bilbao | Metro Bilbao | 41 | 88.2 |
| Spain | Madrid | Madrid Metro | 241 | 626.4 |
| Sweden | Stockholm | Stockholm Metro | 100 | 353 |
| United Kingdom | Glasgow | Glasgow Subway | 15 | 11.4 |
| United Kingdom | London | Docklands Light Railway | 45 | 122.3 |
| United Kingdom | London | London Underground | 270 | 1,378 |
| United Kingdom | Newcastle | Tyne and Wear Metro | 60 | 37.7 |
Sources
Wikipedia. 2019. "List of Metro Systems." Accessed February 24, 2019. https://en.wikipedia.org/wiki/List_of_metro_systems.