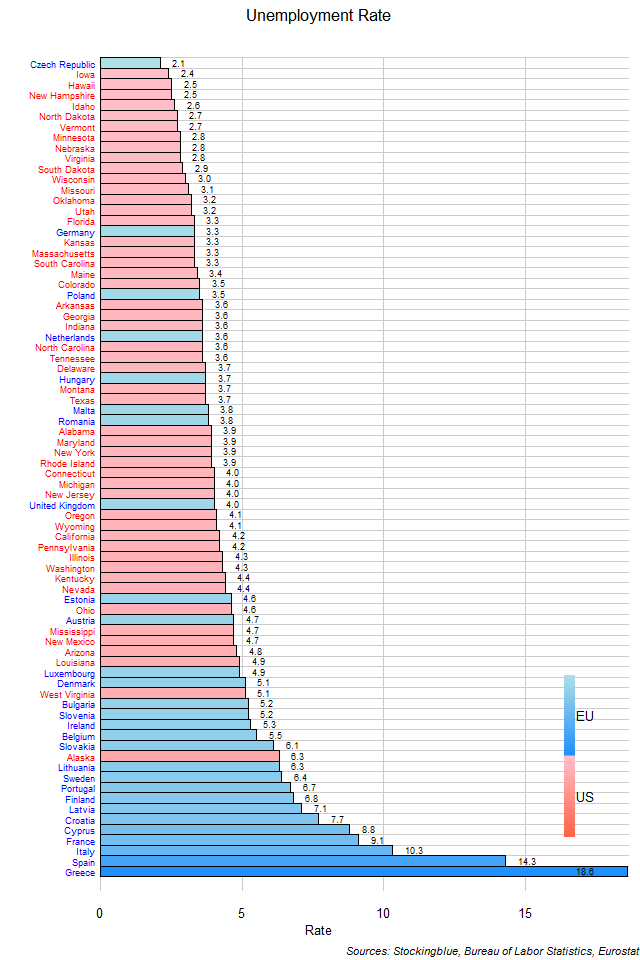
The chart above shows the unemployment rate in each EU and US state as of December 2018 (unless otherwise noted). Although the EU has the state with the lowest unemployment rate, it also has the states with the highest.
Findings
- The difference between the state with the lowest unemployment rate, the Czech Republic, and the state with the highest, Greece, is 16.5 percentage points.
- The Czech Republic has 0.11 times - or just over one-tenth - the unemployment rate that Greece does.
- The difference between the state with the lowest unemployment rate in the EU, the Czech Republic, and the state with the lowest in the US, Iowa, is 0.3 percentage points.
- The Czech Republic has 0.88 times - or just under nine-tenths - the unemployment rate that Iowa does.
- The median unemployment rate in the 28 EU states is 5.25 and the mean 6.30.
- The median unemployment rate in the 50 US states is 3.65 and the mean 3.70.
- The median unemployment rate in the 78 EU and US states is 3.95 and the mean 4.64.
Caveats
- Data is from December 2018 except for Estonia and Hungary which are from November 2018 and Greece and the United Kingdom which are from October 2018.
- All figures are rounded to the nearest hundredth.
Details
Only two US states have an unemployment rate above five percent, West Virginia and Alaska, while the majority of EU states have an unemployment rate above five percent. Eleven EU states have unemployment rates that are higher than every single US state. Under other metrics like GDP or GDP per capita, it is no surprise that Eastern EU states are the outliers and can easily be explained by their recent turn to market economies, but that cannot be said for this metric as countries such as Sweden, Portugal, Finland, France, Italy, Spain, and Greece are included in the lot. Some Eastern EU countries are up there as well which begs the question, why do some EU states tend to have such high unemployment rates when compared to US states?
Six EU states are one standard deviation above the mean and three are two standard deviations above the mean, while not one US state deviates that high above the mean. Not to mention that two EU states are three standard deviations above the mean and one, Greece, is five standard deviations above. Talk about being an outlier. In all fairness, one EU state is one standard deviation from the mean in the low end, Latvia, while no states from the US do so. Then a new question arises, why is there such a huge range in unemployment rates between EU states, particularly when there is no major distinction between established market economies and newer market economies?
Sources
Bureau of Labor Statistics. 2019. "State Employment and Unemployment (Monthly) News Release." Accessed February 6, 2019. https://www.bls.gov/news.release/archives/laus_01182019.htm.
Eurostat. 2019. "Unemployment by Sex and Age - Monthly Average." Accessed February 6, 2019. http://appsso.eurostat.ec.europa.eu/nui/show.do?query=BOOKMARK_DS-055624_QID_6C6753DD_UID_-3F171EB0&layout=TIME,C,X,0;GEO,L,Y,0;S_ADJ,L,Z,0;AGE,L,Z,1;UNIT,L,Z,2;SEX,L,Z,3;INDICATORS,C,Z,4;&zSelection=DS-055624SEX,T;DS-055624UNIT,PC_ACT;DS-055624S_ADJ,SA;DS-055624AGE,TOTAL;DS-055624INDICATORS,OBS_FLAG;&rankName1=TIME_1_0_0_0&rankName2=UNIT_1_2_-1_2&rankName3=GEO_1_2_0_1&rankName4=AGE_1_2_-1_2&rankName5=INDICATORS_1_2_-1_2&rankName6=SEX_1_2_-1_2&rankName7=S-ADJ_1_2_-1_2&sortC=ASC_-1_FIRST&rStp=&cStp=&rDCh=&cDCh=&rDM=true&cDM=true&footnes=false&empty=false&wai=false&time_mode=NONE&time_most_recent=false&lang=EN&cfo=%23%23%23%2C%23%23%23.%23%23%23.