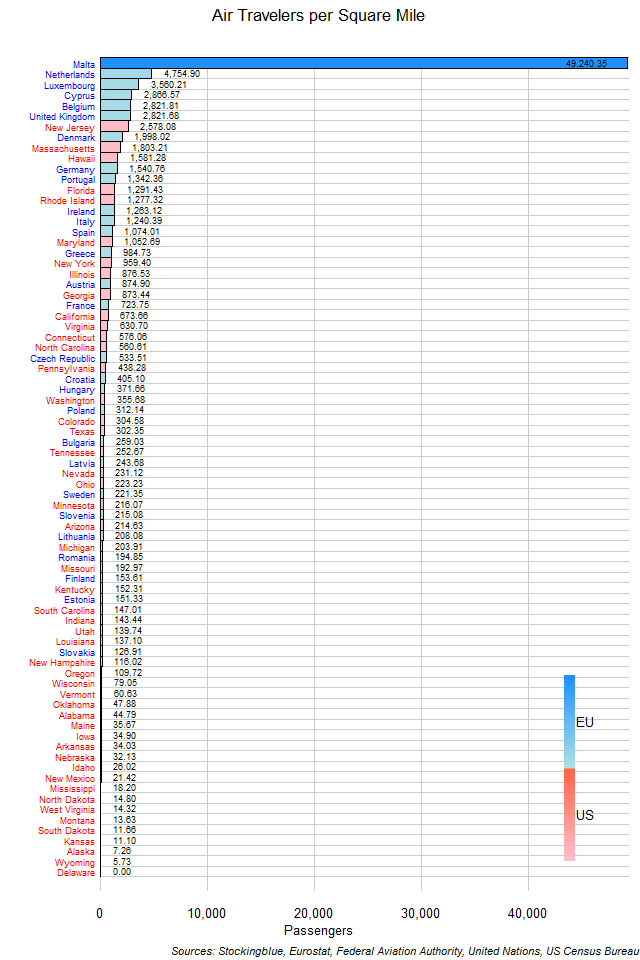
The chart above shows the number of passengers that traveled by air for every square mile in each EU and US state. No state in the EU or the US comes anywhere near the number of air passengers per square mile that Malta has.
Findings
- The difference between the state with the greatest number of air travelers per area, Malta, and the state with the least (that has commercial airports), Wyoming, is 49,234.61 per square mile.
- Malta has 8,590.07 times the number of air travelers per area that Wyoming does.
- The median number of air passengers per square mile in the 28 EU states is 799.30 and the mean 2,875.10.
- The median number of air passengers per square mile in the 50 US states is 149.66 and the mean 382.57.
- The median number of air passengers per square mile in the 78 EU and US states is 237.40 and the mean 1,277.30.
Caveats
- Travel data is from 2017.
- EU area data is from 2007, US area data is from 2010.
- EU and US data come from different sources.
- All figures are rounded to the nearest hundredth.
Details
The United Kingdom which has the most air travelers overall, ranks 17th when its population is taken into account, and sixth in this metric. Malta leads in both the per capita and per area metric.
Of the six states with an area larger than 150,000 square miles, Spain leads in this metric followed by France, California, Texas, Sweden, and Alaska.
Sources
Eurostat. 2018. "Air Passenger Transport by Reporting Country." Accessed December 12, 2018. http://appsso.eurostat.ec.europa.eu/nui/show.do?query=BOOKMARK_DS-054020_QID_63F2F729_UID_-3F171EB0&layout=TIME,C,X,0;GEO,L,Y,0;UNIT,L,Z,0;TRA_MEAS,L,Z,1;SCHEDULE,L,Z,2;TRA_COV,L,Z,3;INDICATORS,C,Z,4;&zSelection=DS-054020TRA_COV,TOTAL;DS-054020SCHEDULE,TOT;DS-054020UNIT,PAS;DS-054020INDICATORS,OBS_FLAG;DS-054020TRA_MEAS,PAS_CRD;&rankName1=UNIT_1_2_-1_2&rankName2=INDICATORS_1_2_-1_2&rankName3=SCHEDULE_1_2_-1_2&rankName4=TRA-COV_1_2_-1_2&rankName5=TRA-MEAS_1_2_-1_2&rankName6=TIME_1_0_0_0&rankName7=GEO_1_2_0_1&sortC=ASC_-1_FIRST&rStp=&cStp=&rDCh=&cDCh=&rDM=true&cDM=true&footnes=false&empty=false&wai=false&time_mode=NONE&time_most_recent=false&lang=EN&cfo=%23%23%23%2C%23%23%23.%23%23%23.
Federal Aviation Authority. 2018. "Enplanements of All Commercial Service Airports (by Rank)." Accessed November 26, 2018. https://www.faa.gov/airports/planning_capacity/passenger_allcargo_stats/passenger/media/cy17-commercial-service-enplanements.pdf.
United Nations. 2007. "United Nations Statistics Division - Environment Statistics." Accessed January 23, 2018. https://unstats.un.org/unsd/environment/totalarea.htm.
United States Census Bureau. September 2012. "United States Summary: 2010: Population and Housing Unit Counts." Accessed January 23, 2018. https://www.census.gov/prod/cen2010/cph-2-1.pdf.