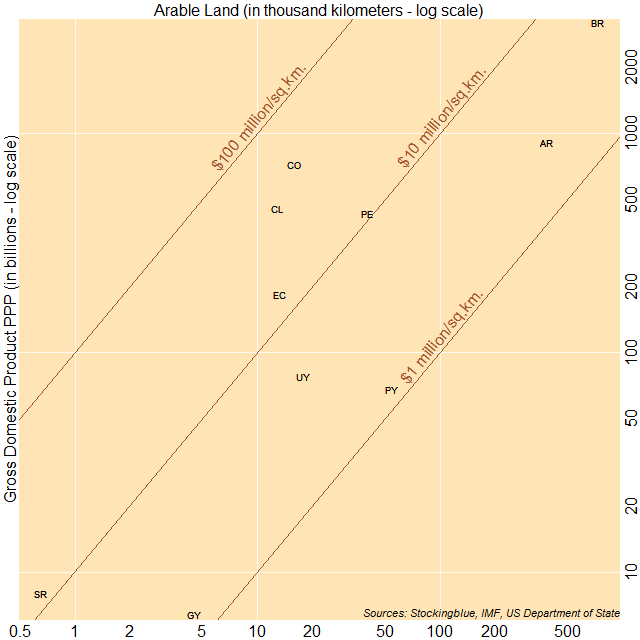
The chart above shows economic output as it relates to arable land. The countries to the top left have a larger ratio of gross domestic product (GDP) to arable land, while countries to the bottom right have a smaller ratio of GDP to arable land. Colombia, Chile, and Ecuador have the largest ratio of GDP to area whereas Argentina, Paraguay, and Guyana have the smallest ratio of GDP to area.
Findings
- All countries have a GDP per square kilometer of arable land between one million and 100 million international dollars.
- Paraguay has the smallest ratio of GDP to arable land with an economy of just over one million times that of its arable land in square kilometers.
- Colombia has the largest ratio of GDP to arable land with an economy of over 45 million times that of its arable land in square kilometers.
Caveats
- Arable land may be a better attribute to use than total land area because it indicates where people are willing to live however, countries are likely to have resources beyond what can be found within their arable lands.
- Bolivia, French Guiana, South Georgia and the South Sandwich Islands, and Venezuela were missing data.
Details
The two biggest economies tend to have a limited economic output per square kilometer of arable land. The third largest economy however, has the best economic output per unit of arable land.
The economic output per unit of arable land seems completely random in South America.
Data
| Code | Country | Arable Land (square km) | GDP (in millions) | GDP Per Square Kilometer |
|---|---|---|---|---|
| PY | Paraguay | 54,756 | 68,005 | 1,241,964 |
| GY | Guyana | 4,515 | 6,398 | 1,417,054 |
| AR | Argentina | 386,476 | 912,816 | 2,361,896 |
| UY | Uruguay | 17,798 | 77,800 | 4,371,278 |
| BR | Brazil | 732,359 | 3,216,031 | 4,391,331 |
| PE | Peru | 39,841 | 429,711 | 10,785,648 |
| SR | Suriname | 655 | 7,961 | 12,154,198 |
| EC | Ecuador | 13,334 | 184,629 | 13,846,483 |
| CL | Chile | 12,854 | 455,941 | 35,470,748 |
| CO | Colombia | 15,946 | 720,151 | 45,161,859 |
Sources
US Department of State. 2017. "The World Factbook." Accessed September 21, 2017. https://www.cia.gov/library/publications/the-world-factbook/fields/2147.html.