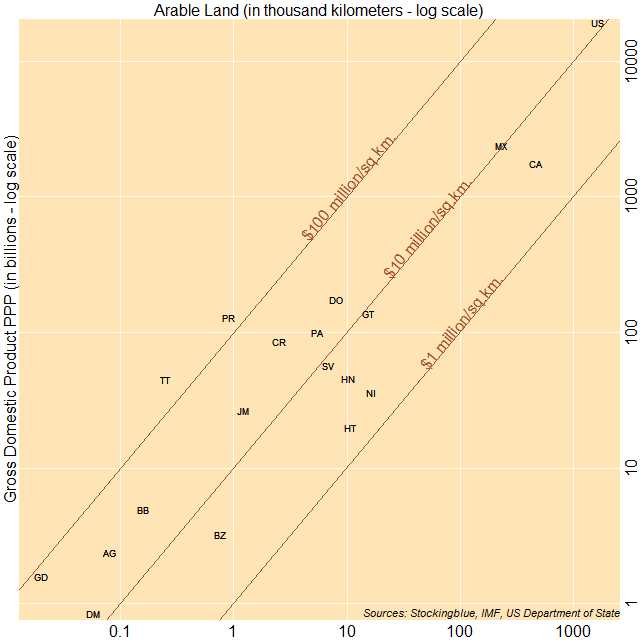
The chart above shows economic output as it relates to arable land. The countries to the top left have a larger ratio of gross domestic product (GDP) to arable land, while countries to the bottom right have a smaller ratio of GDP to arable land. Puerto Rico, Trinidad and Tobago, and Grenada have the largest ratio of GDP to area whereas Haiti, Canada, and Nicaragua have the smallest ratio of GDP to area.
Findings
- All countries have a GDP per square kilometer of arable land of over one million international dollars.
- Haiti has the smallest ratio of GDP to arable land with an economy of just over one million times that of its arable land in square kilometers.
- Trinidad and Tobago has the largest ratio of GDP to arable land with an economy of over 177 million times that of its arable land in square kilometers.
- Only Puerto Rico and Trinidad and Tobago have a GDP that is over 100 million international dollars per square kilometer of arable land.
Caveats
- Arable land may be a better attribute to use than total land area because it indicates where people are willing to live however, countries are likely to have resources beyond what can be found within their arable lands.
- Anguilla, Aruba, Bahamas, Bermuda, Cayman Islands, Cuba, Curaçao, Greenland, Guadeloupe, Martinique, Montserrat, Saint Kitts and Nevis, Saint Lucia, Saint Martin, Saint Pierre and Miquelon, Saint Vincent and the Grenadines, Sint Maarten, Turks and Caicos Islands, the British Virgin Islands, and the US Virgin Islands were missing data.
Details
Even after factoring in for Canada's vast frozen expanse, the country still has one of the lowest economic outputs per square kilometer of arable land.
The United States does not fare as well here as it did when comparing its economic output to its total area. This is due to the fact that the country has large portions of arable land compared to its North American neighbors.
Data
| Code | Country | Arable Land (square km) | GDP (in millions) | GDP Per Square Kilometer |
|---|---|---|---|---|
| HT | Haiti | 10,703 | 19,979 | 1,866,673 |
| NI | Nicaragua | 16,295 | 35,835 | 2,199,141 |
| CA | Canada | 469,281 | 1,752,910 | 3,735,310 |
| BZ | Belize | 758 | 3,252 | 4,290,237 |
| HN | Honduras | 10,201 | 45,628 | 4,472,895 |
| SV | El Salvador | 6,852 | 57,285 | 8,360,333 |
| GT | Guatemala | 15,464 | 138,987 | 8,987,778 |
| MX | Mexico | 231,799 | 2,406,199 | 10,380,541 |
| US | United States | 1,652,028 | 19,417,144 | 11,753,520 |
| DM | Dominica | 57 | 847 | 14,859,649 |
| PA | Panama | 5,504 | 100,512 | 18,261,628 |
| DO | Dominican Republic | 8,084 | 174,180 | 21,546,264 |
| JM | Jamaica | 1,221 | 26,474 | 21,682,228 |
| AG | Antigua and Barbuda | 81 | 2,372 | 29,283,951 |
| BB | Barbados | 160 | 4,983 | 31,143,750 |
| CR | Costa Rica | 2,504 | 85,781 | 34,257,588 |
| GD | Grenada | 20 | 1,588 | 79,400,000 |
| PR | Puerto Rico | 911 | 129,848 | 142,533,480 |
| TT | Trinidad and Tobago | 251 | 44,654 | 177,904,382 |
Sources
US Department of State. 2017. "The World Factbook." Accessed September 21, 2017. https://www.cia.gov/library/publications/the-world-factbook/fields/2147.html.