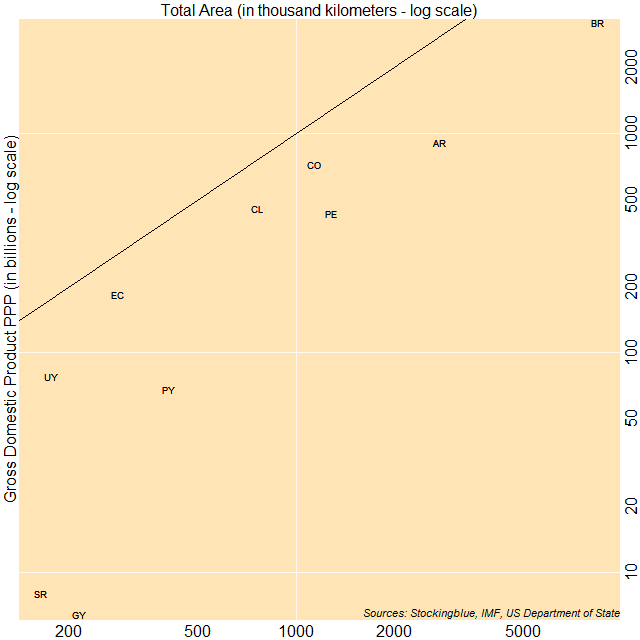
The chart above shows economic output as it relates to land area. The countries to the top left of the diagonal line have a gross domestic product (GDP) of over one million international dollars per square kilometer, while countries to the bottom right have a GDP that is less than one million dollars per square kilometer. Ecuador, Colombia, and Chile have the largest ratio of GDP to area whereas Paraguay, Suriname, and Guyana have the smallest ratio of GDP to area.
Findings
- There are no countries in South America that have a GDP larger than one million international dollars per square kilometer.
- Guyana has the smallest ratio of GDP to area with an economy of just over 29,000 times that of its area in square kilometers.
- Ecuador has the largest ratio of GDP to area with an economy of just over 650,000 times that of its area in square kilometers.
- Only Guyana and Suriname have a GDP that is less than 50,000 international dollars per square kilometer.
Caveats
- A country with a large landmass and a small population is likely to have a smaller ratio, whereas a small country with a large population density can have a larger ratio. Thus the data may not reflect how productive a country is.
- Bolivia, French Guiana, South Georgia and the South Sandwich Islands, and Venezuela were missing data.
Details
Not one single country on the continent has a GDP per square kilometer over one million international dollars. Compared that to North America where countries have a GDP of up 11 million international dollars per square kilometer.
The fact that Guyana and Suriname are almost entirely tropical rain forests may have something to do with their limited economic output.
Data
| Code | Country | Area (square km) | GDP (in millions) | GDP Per Square Kilometer |
|---|---|---|---|---|
| GY | Guyana | 214,969 | 6,398 | 29,762.43 |
| SR | Suriname | 163,820 | 7,961 | 48,596.02 |
| PY | Paraguay | 406,752 | 68,005 | 167,190.33 |
| AR | Argentina | 2,780,400 | 912,816 | 328,303.84 |
| PE | Peru | 1,285,216 | 429,711 | 334,349.25 |
| BR | Brazil | 8,515,770 | 3,216,031 | 377,655.93 |
| UY | Uruguay | 176,215 | 77,800 | 441,506.11 |
| CL | Chile | 756,102 | 455,941 | 603,015.20 |
| CO | Colombia | 1,138,910 | 720,151 | 632,315.99 |
| EC | Ecuador | 283,651 | 184,629 | 650,901.99 |
Sources
US Department of State. 2017. "The World Factbook." Accessed September 21, 2017. https://www.cia.gov/library/publications/the-world-factbook/fields/2147.html.