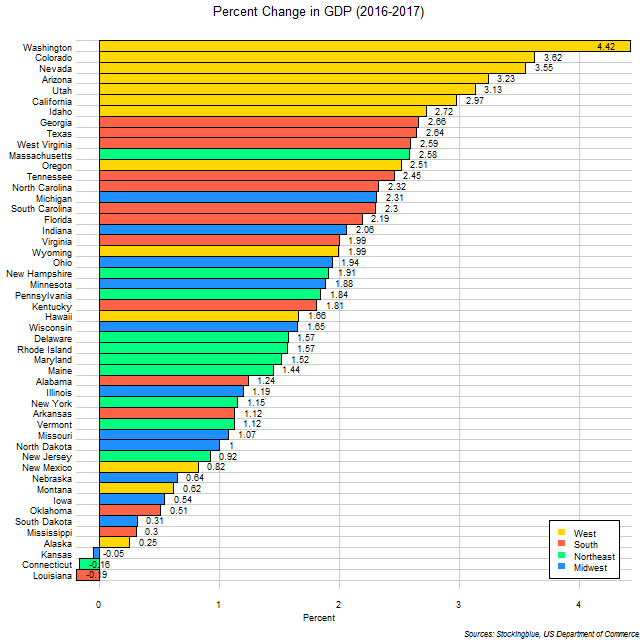
The chart above shows change in GDP over the last year in US states. Seven out of the top ten (and all of the top seven) states with the highest growth are from the West while the remaining three are all from the South.
Findings
- The difference between the state with the greatest growth in GDP, Washington, and the state with the least, Alaska, is 4.17 percentage points.
- Washington has 17.58 times the economic growth that Alaska does in the past year.
- The mean economic growth for the 50 states is 1.71 percent and the median is 1.73 percent.
- Western states' growth ranged from 0.25 to 4.42 percent.
- Southern states' growth ranged from -0.19 to 2.66 percent.
- Northeastern states' growth ranged from -0.16 to 2.58 percent.
- Midwestern states' growth ranged from -0.05 to 2.31 percent.
Caveats
- All figures are rounded to the nearest hundredth.
Details
Connecticut is the only state whose economy shrank in the past year as well as over the past ten years. On the more productive side, Washington, Colorado, Utah, California, and Texas are the only states to be among the five fastest growing economies over the past year and the past ten years.
The United States as a whole has 2.07 percent growth over the same one year period ranking it under Florida and just above Indiana.
Sources
US Department of Commerce. 2018. "US Bureau of Economic Analysis." Accessed June 26, 2018. https://bea.gov/itable/iTable.cfm?ReqID=70&step=1#reqid=70&step=10&isuri=1&7003=1000&7035=-1&7004=naics&7005=1&7006=01000,02000,04000,05000,06000,08000,09000,10000,11000,12000,13000,15000,16000,17000,18000,19000,20000,21000,22000,23000,24000,25000,26000,27000,28000,29000,30000,31000,32000,33000,34000,35000,36000,37000,38000,39000,40000,41000,42000,44000,45000,46000,47000,48000,49000,50000,51000,53000,54000,55000,56000&7036=-1&7001=11000&7002=1&7090=70&7007=2017,2016,2015,2014,2013,2012,2011,2010,2009,2008,2007,2006&7093=levels.