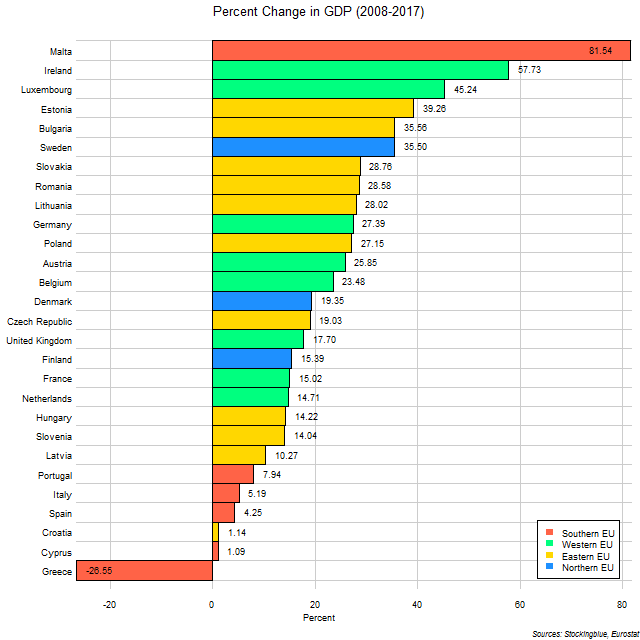
The chart above shows change in GDP over the last ten years in EU states. Malta and Ireland are the only two states to have increased their economies by half. Four other states managed to increase theirs by one-third and an additional six grew their economies by one-quarter. One economy shrank in the past ten years.
Findings
- The difference between the state with the greatest growth in GDP, Malta, and the state with the least, Cyprus, is 80.45 percentage points.
- Malta has 80.45 times the economic growth that Cyprus does in the past decade.
- The mean economic growth for the 28 states is 22.03 percent and the median is 19.19 percent.
- Southern EU states' growth ranged from -26.55 to 81.54 percent. The Southern EU has the economies with the highest growth and contraction in the Union.
- Western EU states' growth ranged from 14.71 to 57.73 percent.
- Eastern EU states' growth ranged from 1.14 to 39.26 percent.
- Northern EU states' growth ranged from 15.39 to 35.50 percent.
Caveats
- All figures are rounded to the nearest hundredth.
Details
It is interesting to note that all the Southern EU states (save for Malta) are at the bottom of the chart taking up the bottom five out of six spots. Croatia from the Eastern EU makes up the other spot on the bottom.
The European Union as a whole has 17.31 percent growth over the same ten year period ranking it just under the United Kingdom and above Finland.
Sources
Eurostat. 2018. "Eurostat - Tables, Graphs and Maps Interface." Accessed June 26, 2018. http://ec.europa.eu/eurostat/tgm/table.do?tab=table&init=1&language=en&pcode=tec00001&plugin=1.