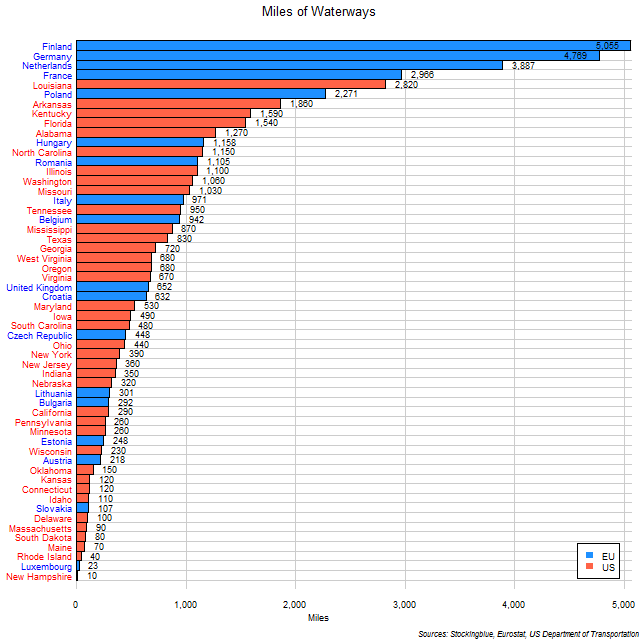
The chart above shows the length of waterways in EU and US states. Finland not only tops the chart but accounts for one-tenth of the total waterways in the EU and the US.
Findings
- The difference between the state with the most waterways, Finland, and the state with the least, New Hampshire, is 5,045 miles (8,119 km).
- Finland has 506 times the waterways that New Hampshire does.
- Only Finland has more than 5,000 miles (8,047 km) of waterways.
- Only six states have more than 2,000 miles (3,219 km) of waterways (only one of which is from the US).
- The mean of the 18 EU states is 1,447 miles (2,329 km) and the median 797 miles (1,283 km) of waterways.
- The mean of the 38 US states is 635 miles (1,021 km) and the median 460 miles (740 km) of waterways.
- The mean of the 56 EU and US states is 896 miles (1,441 km) and the median 510 miles (821 km) of waterways.
Caveats
- EU waterway data is from 2016 except for Belgium (2008), Germany (2013), Luxembourg (2009), and Romania (2015). US waterway data is from 2013.
- EU and US data come from different sources and may define waterways differently.
- All figures are rounded to the nearest whole.
- Cyprus, Denmark, Greece, Ireland, Latvia, Malta, Portugal, Slovenia, Spain, and Sweden from the EU and Alaska, Arizona, Colorado, Hawaii, Michigan, Montana, Nevada, New Mexico, North Dakota, Utah, Vermont, and Wyoming from the US did not have any data.
Details
The top three states account for a quarter of the inland waterways in both the EU and the US and they are all EU states. The top four (also all from the EU) account for one-third of the total waterways in the two superstates.
The European Union as a whole has 26,046 miles (41,917 km) of waterways. The United States as a whole has 24,110 miles (38,801 km) of waterways.
Sources
United States Department of Transportation. 2015. "State Transportation by the Numbers." Accessed March 21, 2018. https://www.bts.gov/sites/bts.dot.gov/files/legacy/_entire.pdf.