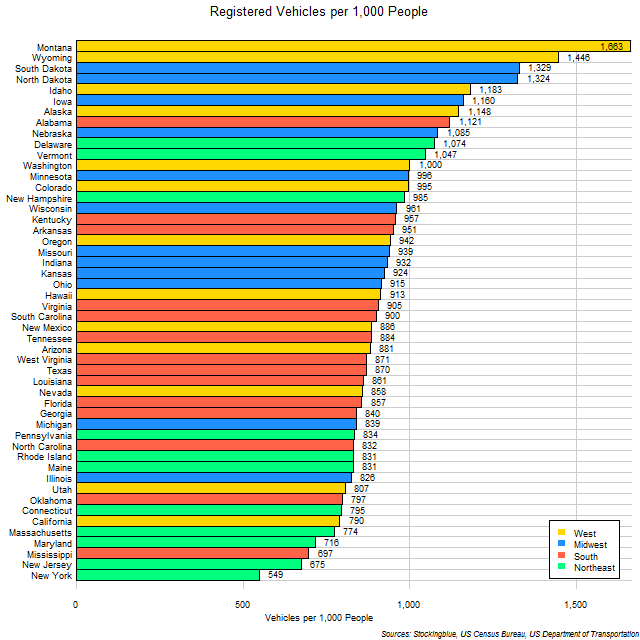
The chart above shows the rate of motor vehicle ownership in US states. Eleven states have more vehicles than people.
Findings
- The difference between the state with the largest ownership rate, Montana, and the state with the smallest rate, New York, is 1,114 vehicles per 1,000 people.
- Montana has over three times the ownership rate than New York does.
- Eleven states have more vehicles than people, one has as many vehicles as people, and all but three have over 700 vehicles per 1,000 people.
- The mean ownership rate for the US is 943.9 and the median 902.4.
Caveats
- Vehicle ownership data is from 2015.
- Population data is from 2010.
- Total vehicles include automobiles, taxis, buses, trucks, and motorcycles of both public and private use.
Details
The highest ownership rates are in large rural states, with the exception of Alaska which does not have roads connecting most of its towns. Every single state in the US has at least one vehicle for every two people that live there. Note that vehicle ownership does not correlate with wealth as some of the wealthiest states have low rates of vehicle registrations.
The ownership rate for the entire United States is 854 vehicles per 1,000 inhabitants which ranks the US as a whole just under Florida and just above Georgia.
Sources
United States Census Bureau. "Annual Estimates of the Resident Population: April 1, 2010 to July 1, 2016." Accessed December 12, 2017. http://factfinder2.census.gov.
United States Department of Transportation. 2018. "Table MV-1 - Highway Statistics 2015." Accessed February 20, 2018. https://www.fhwa.dot.gov/policyinformation/statistics/2015/mv1.cfm.