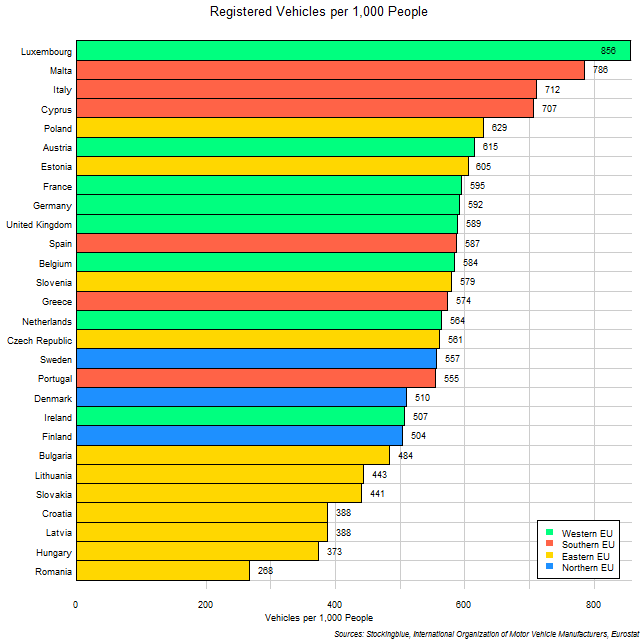
The chart above shows the rate of motor vehicle ownership in EU states. Only states in the Eastern EU have ownership rates of less than one vehicle for every two people.
Findings
- The difference between the state with the largest ownership rate, Luxembourg, and the state with the smallest rate, Romania, is 588 vehicles per 1,000 people.
- Luxembourg has over three times the ownership rate than Romania does.
- Only four states have over 700 vehicles for every 1,000 inhabitants: Luxembourg, Malta, Italy, and Cyprus.
- The mean ownership rate for the EU is 555.5 and the median 568.9.
Caveats
- Vehicle ownership data is from 2015.
- Population data is from 2011.
- Total vehicles include automobiles, taxis, buses, trucks, and motorcycles of both public and private use.
Details
It is surprising to see that some of the highest vehicle ownership rates are in such small states. One would think the farther one has to travel the more likely they are to own a vehicle. One possible factor could be that the small states are more urbanized and thus have a greater proportion of buses to the total population. But then there are also small states with low rates as well such as Latvia and Ireland.
The ownership rate for the entire European Union is 578 vehicles per 1,000 inhabitants which ranks the EU as a whole just under Slovenia and just above Greece.
Sources
Eurostat. 2017. "Data Explorer." Accessed December 11, 2017. http://appsso.eurostat.ec.europa.eu/nui/show.do?dataset=urb_lpop1&lang=en.
International Organization of Motor Vehicle Manufacturers. 2018. "Vehicles in Use - OICA." Accessed January 20, 2018. http://www.oica.net/category/vehicles-in-use/.