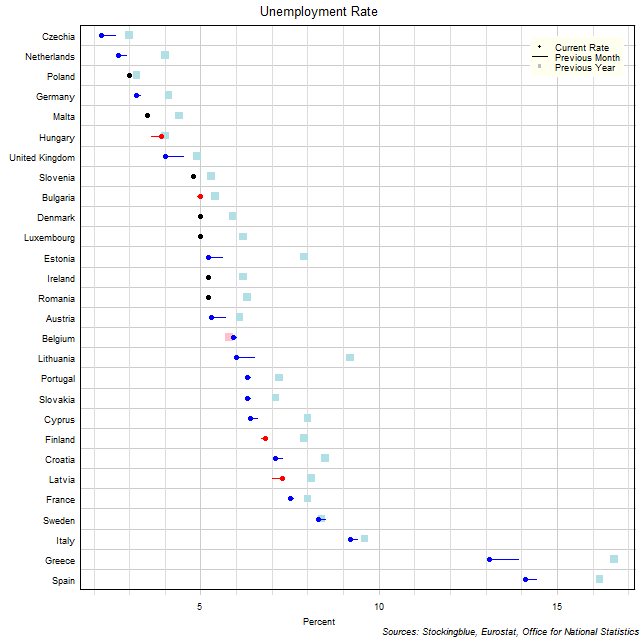
The chart above shows the unemployment rate in each EU state as of November 2021 (unless otherwise noted - see caveats below), the change from the previous month, and the rate one year prior. Two states have an unemployment rate below three percent.
Findings
- The difference between the state with the lowest unemployment rate, Czechia, and the state with the highest, Spain, is 11.90 percentage points (up from 11.80 last month and down from 13.60 last year). Czechia had the lowest rate last month and the lowest rate last year. Spain had the highest rate last month and Greece had the highest rate last year.
- Spain has 6.41 times the unemployment rate that Czechia does. The ratio of highest rate to lowest rate was up from 5.54 last month and up from 5.53 last year.
- The median unemployment rate in the 28 EU states is 5.25 (down from 5.65 the previous month and down from 6.25 last year) and the mean 5.98 (down from 6.12 the previous month and down from 7.05 last year).
- Of the 28 states, 7 saw no change in the unemployment rate from the previous month, 17 saw an improvement, and 4 saw the rate increase.
- Of the 28 states, 0 saw no change in the unemployment rate from last year, 27 saw an improvement, and 1 saw the rate increase.
Caveats
- Data is from November 2021 except for Estonia and Hungary which are from October 2021, and Greece and the United Kingdom which are from September 2021 (previous month and year rates also reflect the respective one, two, and three month delay).
- Data may conflict with previous month's report as statistical agencies make updates to the rates over the course of the month.
- All figures are rounded to the nearest hundredth.
Details
In absolute terms, Greece had the best performance over the previous month dropping 0.8 percentage points. Latvia and Hungary had the worst performance rising 0.3 percentage points. Year over year, Greece had the best performance with a 3.5 percentage point drop while Belgium had the worst performance with a 0.1 percentage point rise in the unemployment rate.
In relative terms, Czechia had the best performance over the previous month with a 15.38% drop in the rate while Hungary had the worst performance with a 8.33% rise in the rate. Year over year, Lithuania had the best performance with a 34.78% drop in the rate while Belgium had the worst performance with a 1.72% rise in the rate.
Of the 28 states, 6 EU states have an unemployment rate below four percent (same as 6 last month, up from 2 last year) which traditionally has placed inflationary pressure on wages. Of the 28, 18 have a rate between four and eight percent (same as 18 last month, down from 19 last year), and 4 have a rate above eight percent (same as 4 last month, down from 7 last year).
Estonia (from 14th to 12th) and Lithuania (from 19th to 17th) rose 2 spots over the course of the month. On the flip side, Portugal (from 17th to 18th), Slovakia (from 17th to 18th), and Latvia (from 22nd to 23rd) fell 1 spot. Year-over-year, Lithuania (from 25th to 17th) rose 8 spots. Conversely, Belgium (from 10th to 16th) fell 6 spots.
Data
| State | Last Year | Previous Rate | Latest Rate |
|---|---|---|---|
| Austria | 6.1 | 5.7 | 5.3 |
| Belgium | 5.8 | 6 | 5.9 |
| Bulgaria | 5.4 | 4.9 | 5 |
| Croatia | 8.5 | 7.3 | 7.1 |
| Cyprus | 8 | 6.6 | 6.4 |
| Czechia | 3 | 2.6 | 2.2 |
| Denmark | 5.9 | 5 | 5 |
| Estonia | 7.9 | 5.6 | 5.2 |
| Finland | 7.9 | 6.7 | 6.8 |
| France | 8 | 7.6 | 7.5 |
| Germany | 4.1 | 3.3 | 3.2 |
| Greece | 16.6 | 13.9 | 13.1 |
| Hungary | 4 | 3.6 | 3.9 |
| Ireland | 6.2 | 5.2 | 5.2 |
| Italy | 9.6 | 9.4 | 9.2 |
| Latvia | 8.1 | 7 | 7.3 |
| Lithuania | 9.2 | 6.5 | 6 |
| Luxembourg | 6.2 | 5 | 5 |
| Malta | 4.4 | 3.5 | 3.5 |
| Netherlands | 4 | 2.9 | 2.7 |
| Poland | 3.2 | 3 | 3 |
| Portugal | 7.2 | 6.4 | 6.3 |
| Romania | 6.3 | 5.2 | 5.2 |
| Slovakia | 7.1 | 6.4 | 6.3 |
| Slovenia | 5.3 | 4.8 | 4.8 |
| Spain | 16.2 | 14.4 | 14.1 |
| Sweden | 8.4 | 8.5 | 8.3 |
| United Kingdom | 4.9 | 4.5 | 4 |
Sources
Eurostat. 2021. "Unemployment by Sex and Age - Monthly Average." Accessed January 11, 2021. https://appsso.eurostat.ec.europa.eu/nui/show.do?query=BOOKMARK_DS-055624_QID_1B89059D_UID_-3F171EB0&layout=TIME,C,X,0;GEO,L,Y,0;S_ADJ,L,Z,0;AGE,L,Z,1;UNIT,L,Z,2;SEX,L,Z,3;INDICATORS,C,Z,4;&zSelection=DS-055624AGE,TOTAL;DS-055624S_ADJ,SA;DS-055624UNIT,PC_ACT;DS-055624SEX,T;DS-055624INDICATORS,OBS_FLAG;&rankName1=UNIT_1_2_-1_2&rankName2=AGE_1_2_-1_2&rankName3=INDICATORS_1_2_-1_2&rankName4=SEX_1_2_-1_2&rankName5=S-ADJ_1_2_-1_2&rankName6=TIME_1_0_0_0&rankName7=GEO_1_2_0_1&sortC=ASC_-1_FIRST&rStp=&cStp=&rDCh=&cDCh=&rDM=true&cDM=true&footnes=false&empty=false&wai=false&time_mode=NONE&time_most_recent=false&lang=EN&cfo=%23%23%23%2C%23%23%23.%23%23%23.
Office for National Statistics. 2021. "X01: Labour Force Survey Single-Month Estimates." Accessed January 11, 2021. https://www.ons.gov.uk/employmentandlabourmarket/peopleinwork/employmentandemployeetypes/datasets/labourforcesurveysinglemonthestimatesx01.